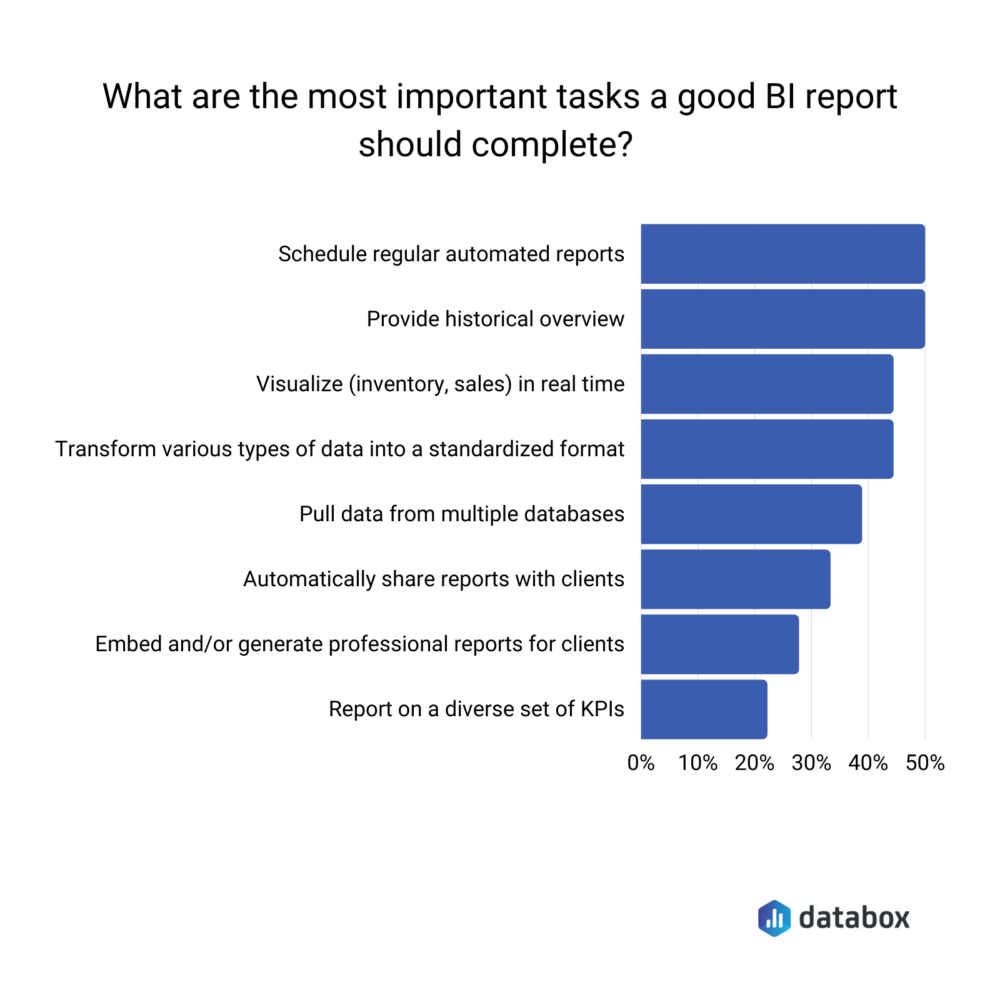
Business intelligence (BI) reporting has evolved from a simple data visualization tool to a critical component of strategic decision-making. In today’s complex business landscape, organizations are increasingly reliant on data to understand trends, identify opportunities, and mitigate risks. Effective BI reporting isn’t just about presenting numbers; it’s about translating raw data into actionable insights that drive performance and competitive advantage. This article will explore key strategies for crafting robust and impactful business intelligence reports, focusing on the core principles and best practices for success. Business intelligence reporting is no longer a ‘nice-to-have’ – it’s a fundamental necessity for informed leadership and operational efficiency. Let’s delve into how to build reports that truly deliver value.
Understanding the Importance of Business Intelligence Reporting
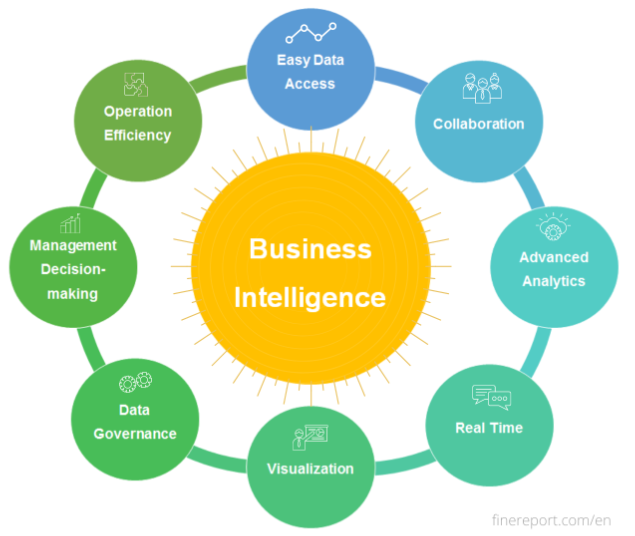
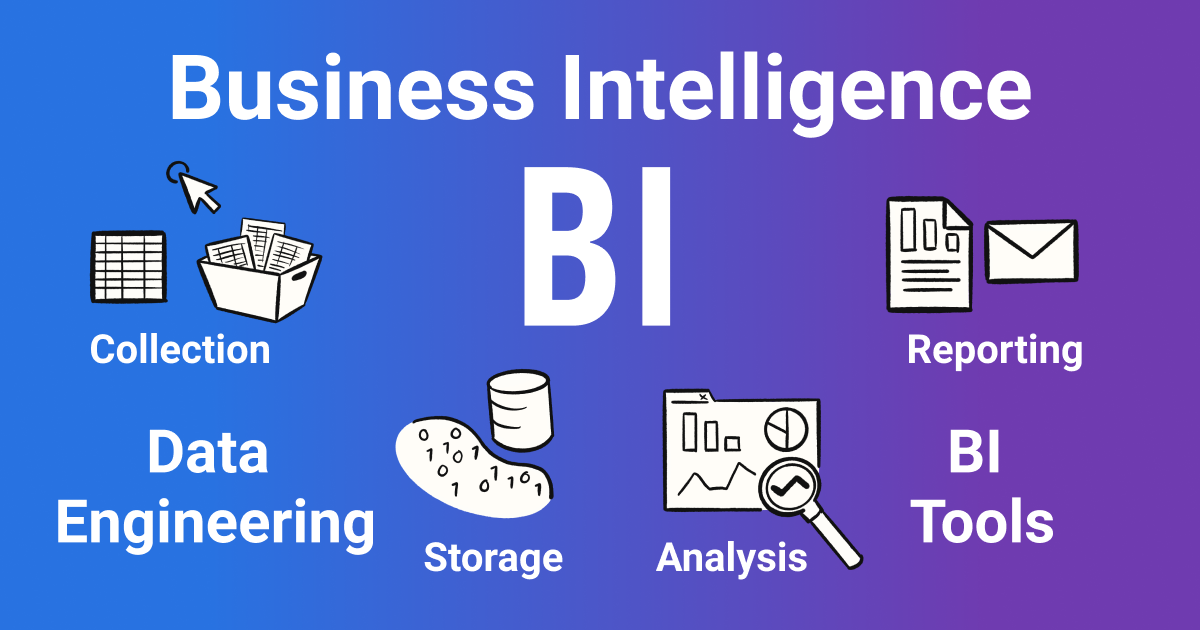
The shift towards data-driven decision-making is undeniable. Businesses are grappling with the challenge of collecting, processing, and analyzing vast amounts of data from diverse sources – sales, marketing, operations, customer service, and more. Without a structured approach to reporting, this data remains siloed, difficult to interpret, and ultimately, ineffective. Poorly executed BI reports can lead to wasted resources, missed opportunities, and ultimately, a decline in overall business performance. A well-defined BI strategy, underpinned by robust reporting, is therefore paramount. It’s about moving beyond simply tracking metrics to understanding why they’re trending and what actions to take based on those insights. The benefits extend far beyond simply generating reports; they encompass improved forecasting, optimized resource allocation, and enhanced customer understanding.

Defining Your Reporting Objectives
Before embarking on any BI project, it’s crucial to clearly define your reporting objectives. What specific questions are you trying to answer? What key performance indicators (KPIs) are you focused on? Are you aiming to improve sales, reduce costs, enhance customer satisfaction, or something else entirely? A clear understanding of your objectives will guide your data selection, analysis techniques, and ultimately, the content of your reports. For example, a manufacturing company might prioritize reporting on production efficiency, while a retail business might focus on sales trends and customer behavior. Documenting these objectives will ensure that your reports remain relevant and aligned with the overall business strategy. Consider using the SMART framework – Specific, Measurable, Achievable, Relevant, and Time-bound – to refine your objectives.
The Role of Data Governance
Effective business intelligence relies on strong data governance. This encompasses policies and procedures for managing data quality, security, and access. Poor data quality – inaccurate, incomplete, or inconsistent data – will invariably lead to flawed insights and misleading reports. Data governance ensures that data is reliable, trustworthy, and readily available to those who need it. This includes establishing data standards, implementing data validation rules, and providing training to users on data management best practices. Without robust data governance, your BI efforts will be undermined by a foundation of unreliable data. Investing in data governance is an investment in the long-term success of your reporting initiatives.
Key BI Reporting Techniques and Tools
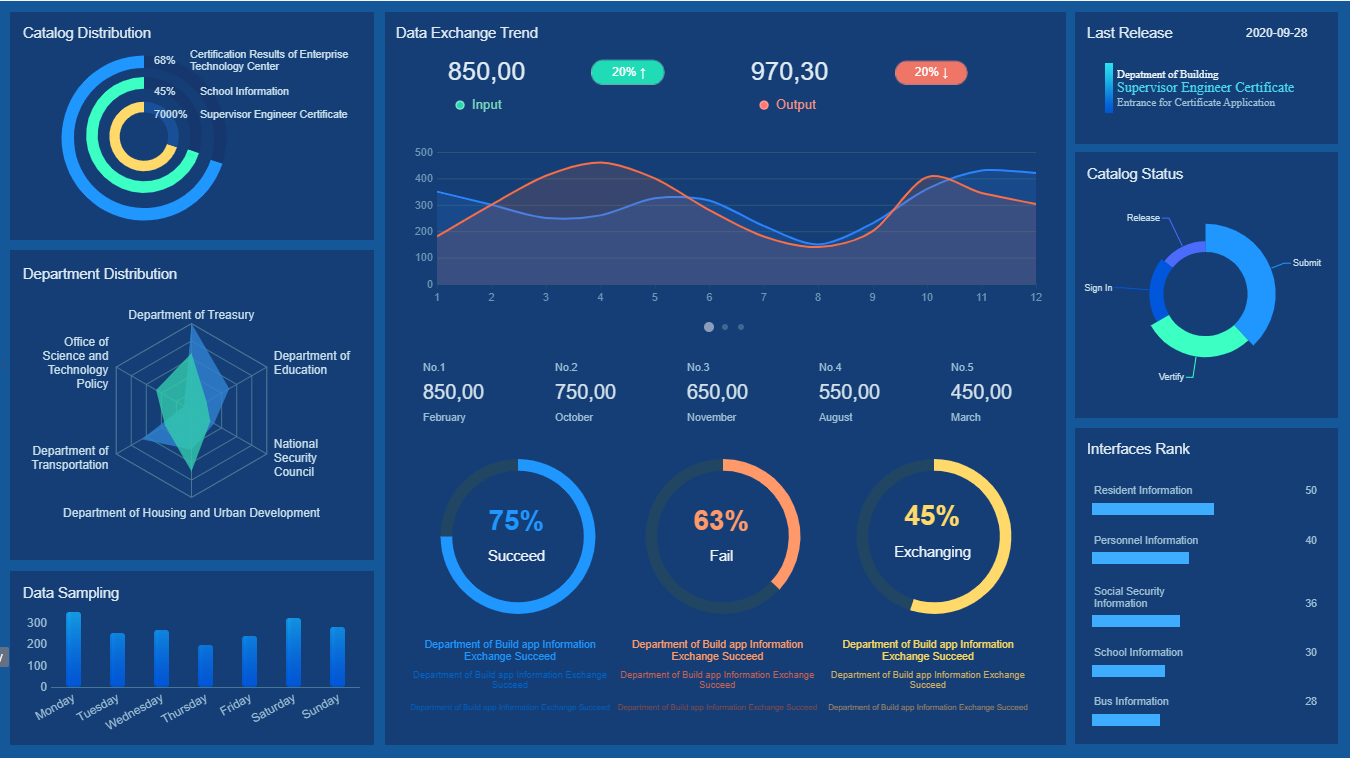
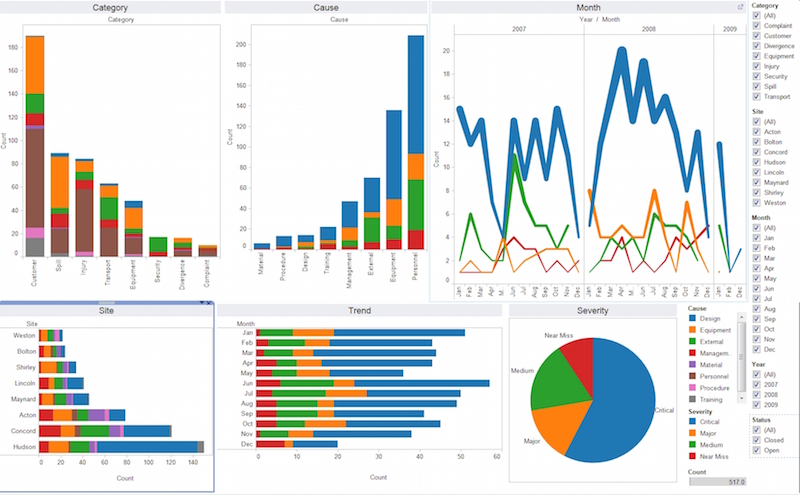
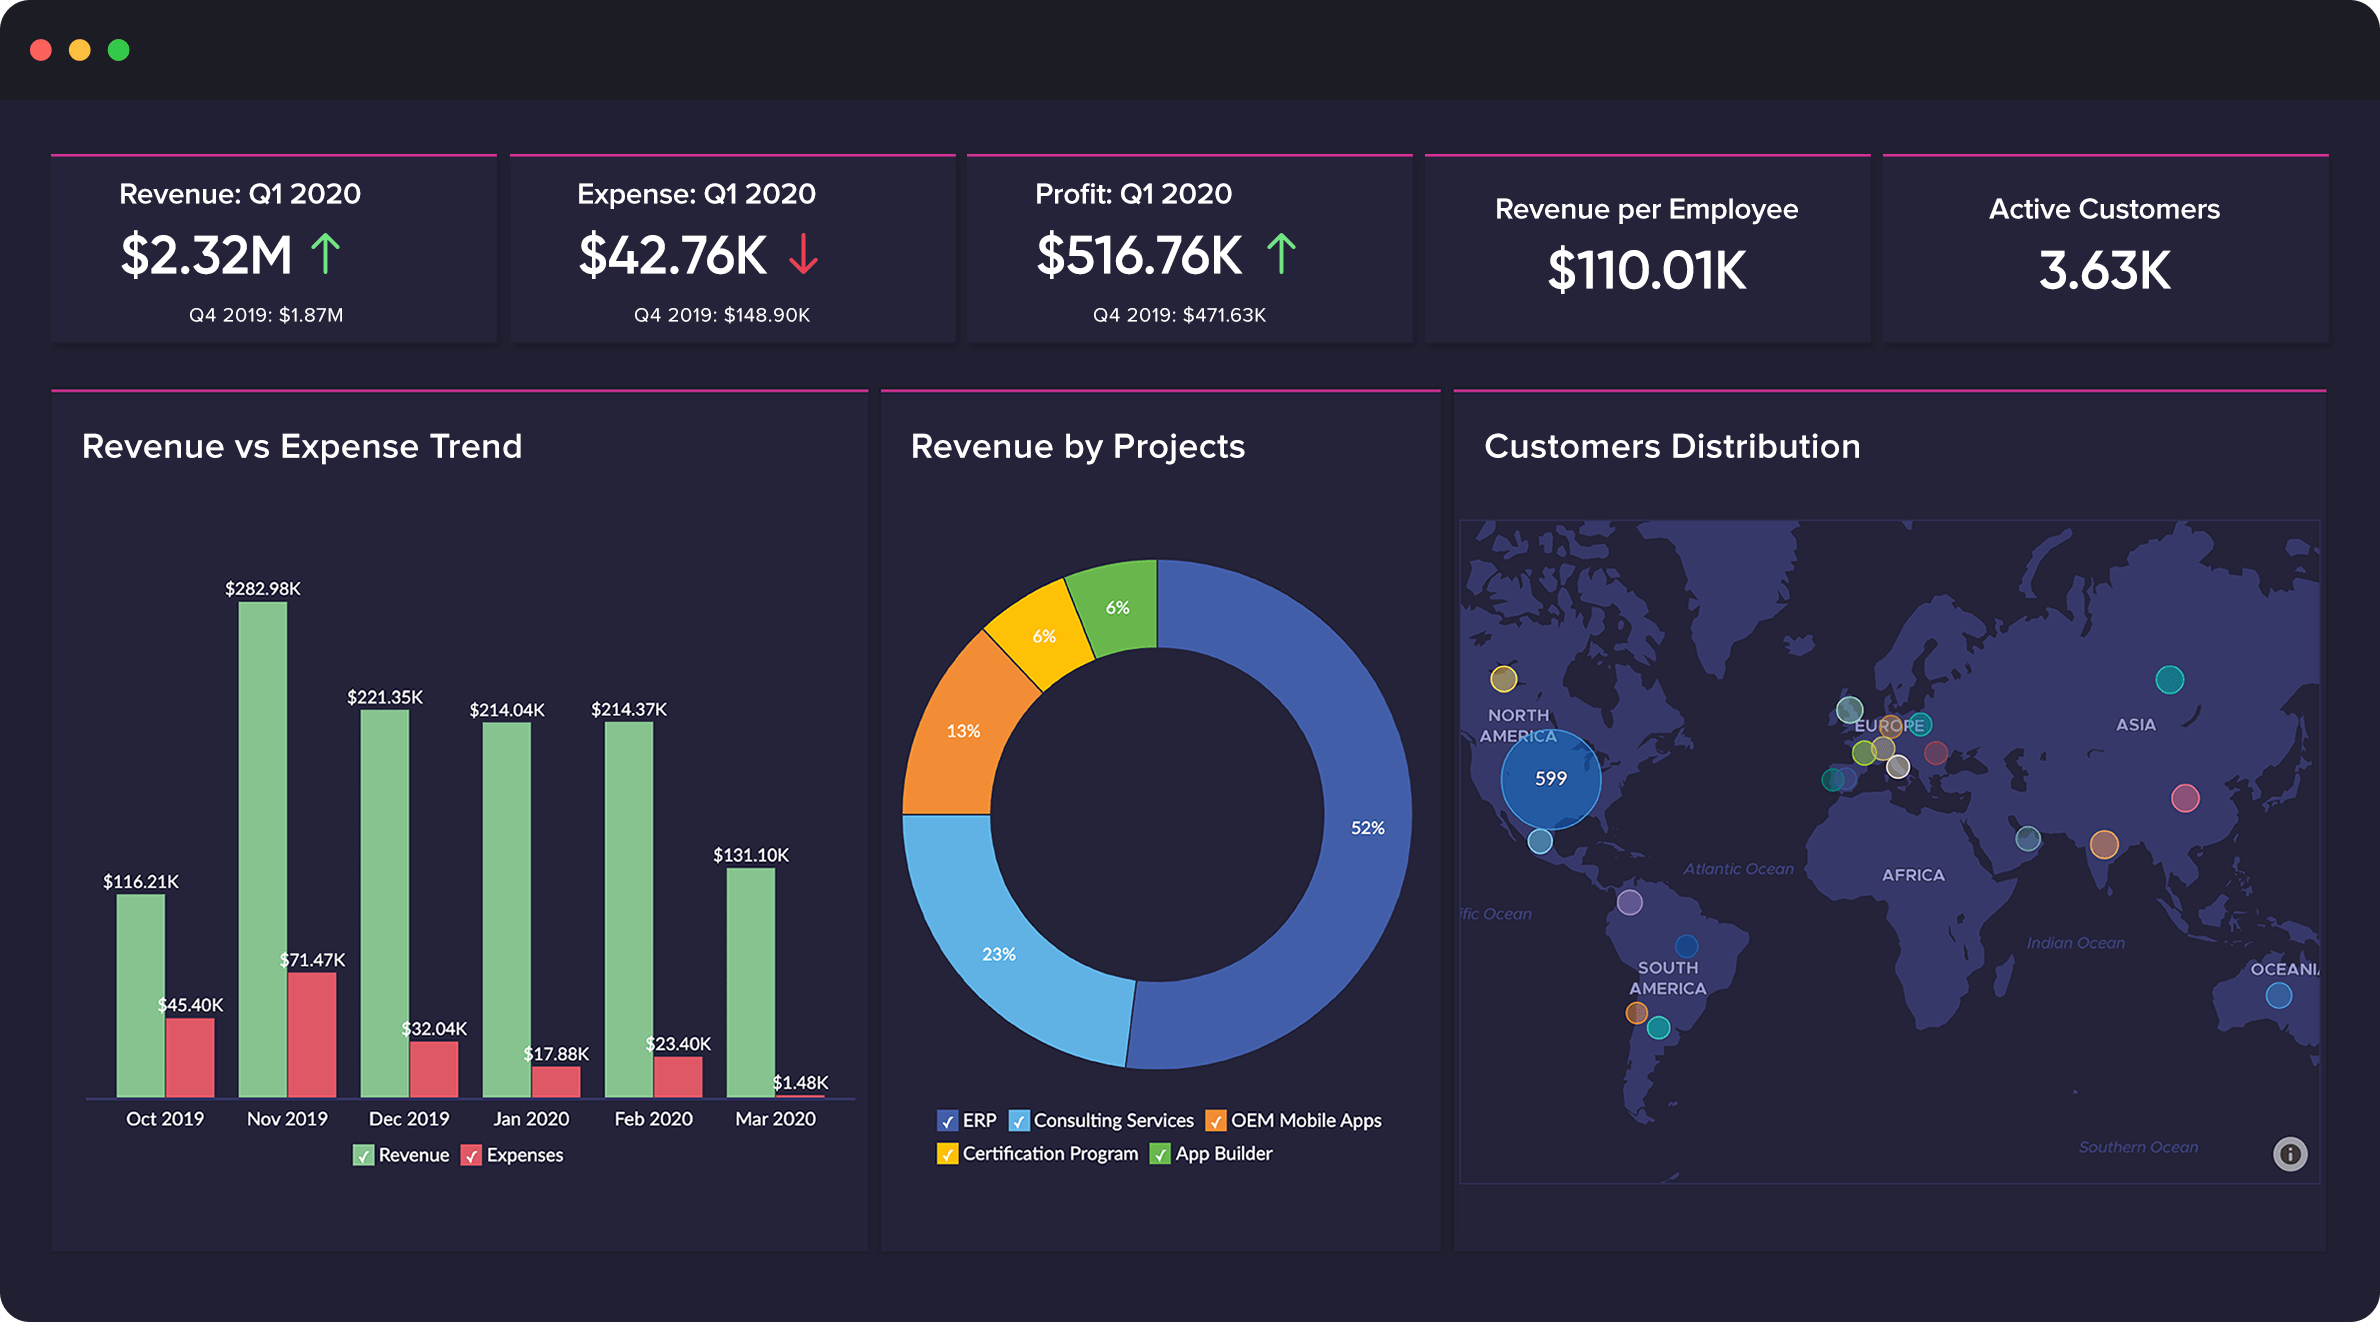
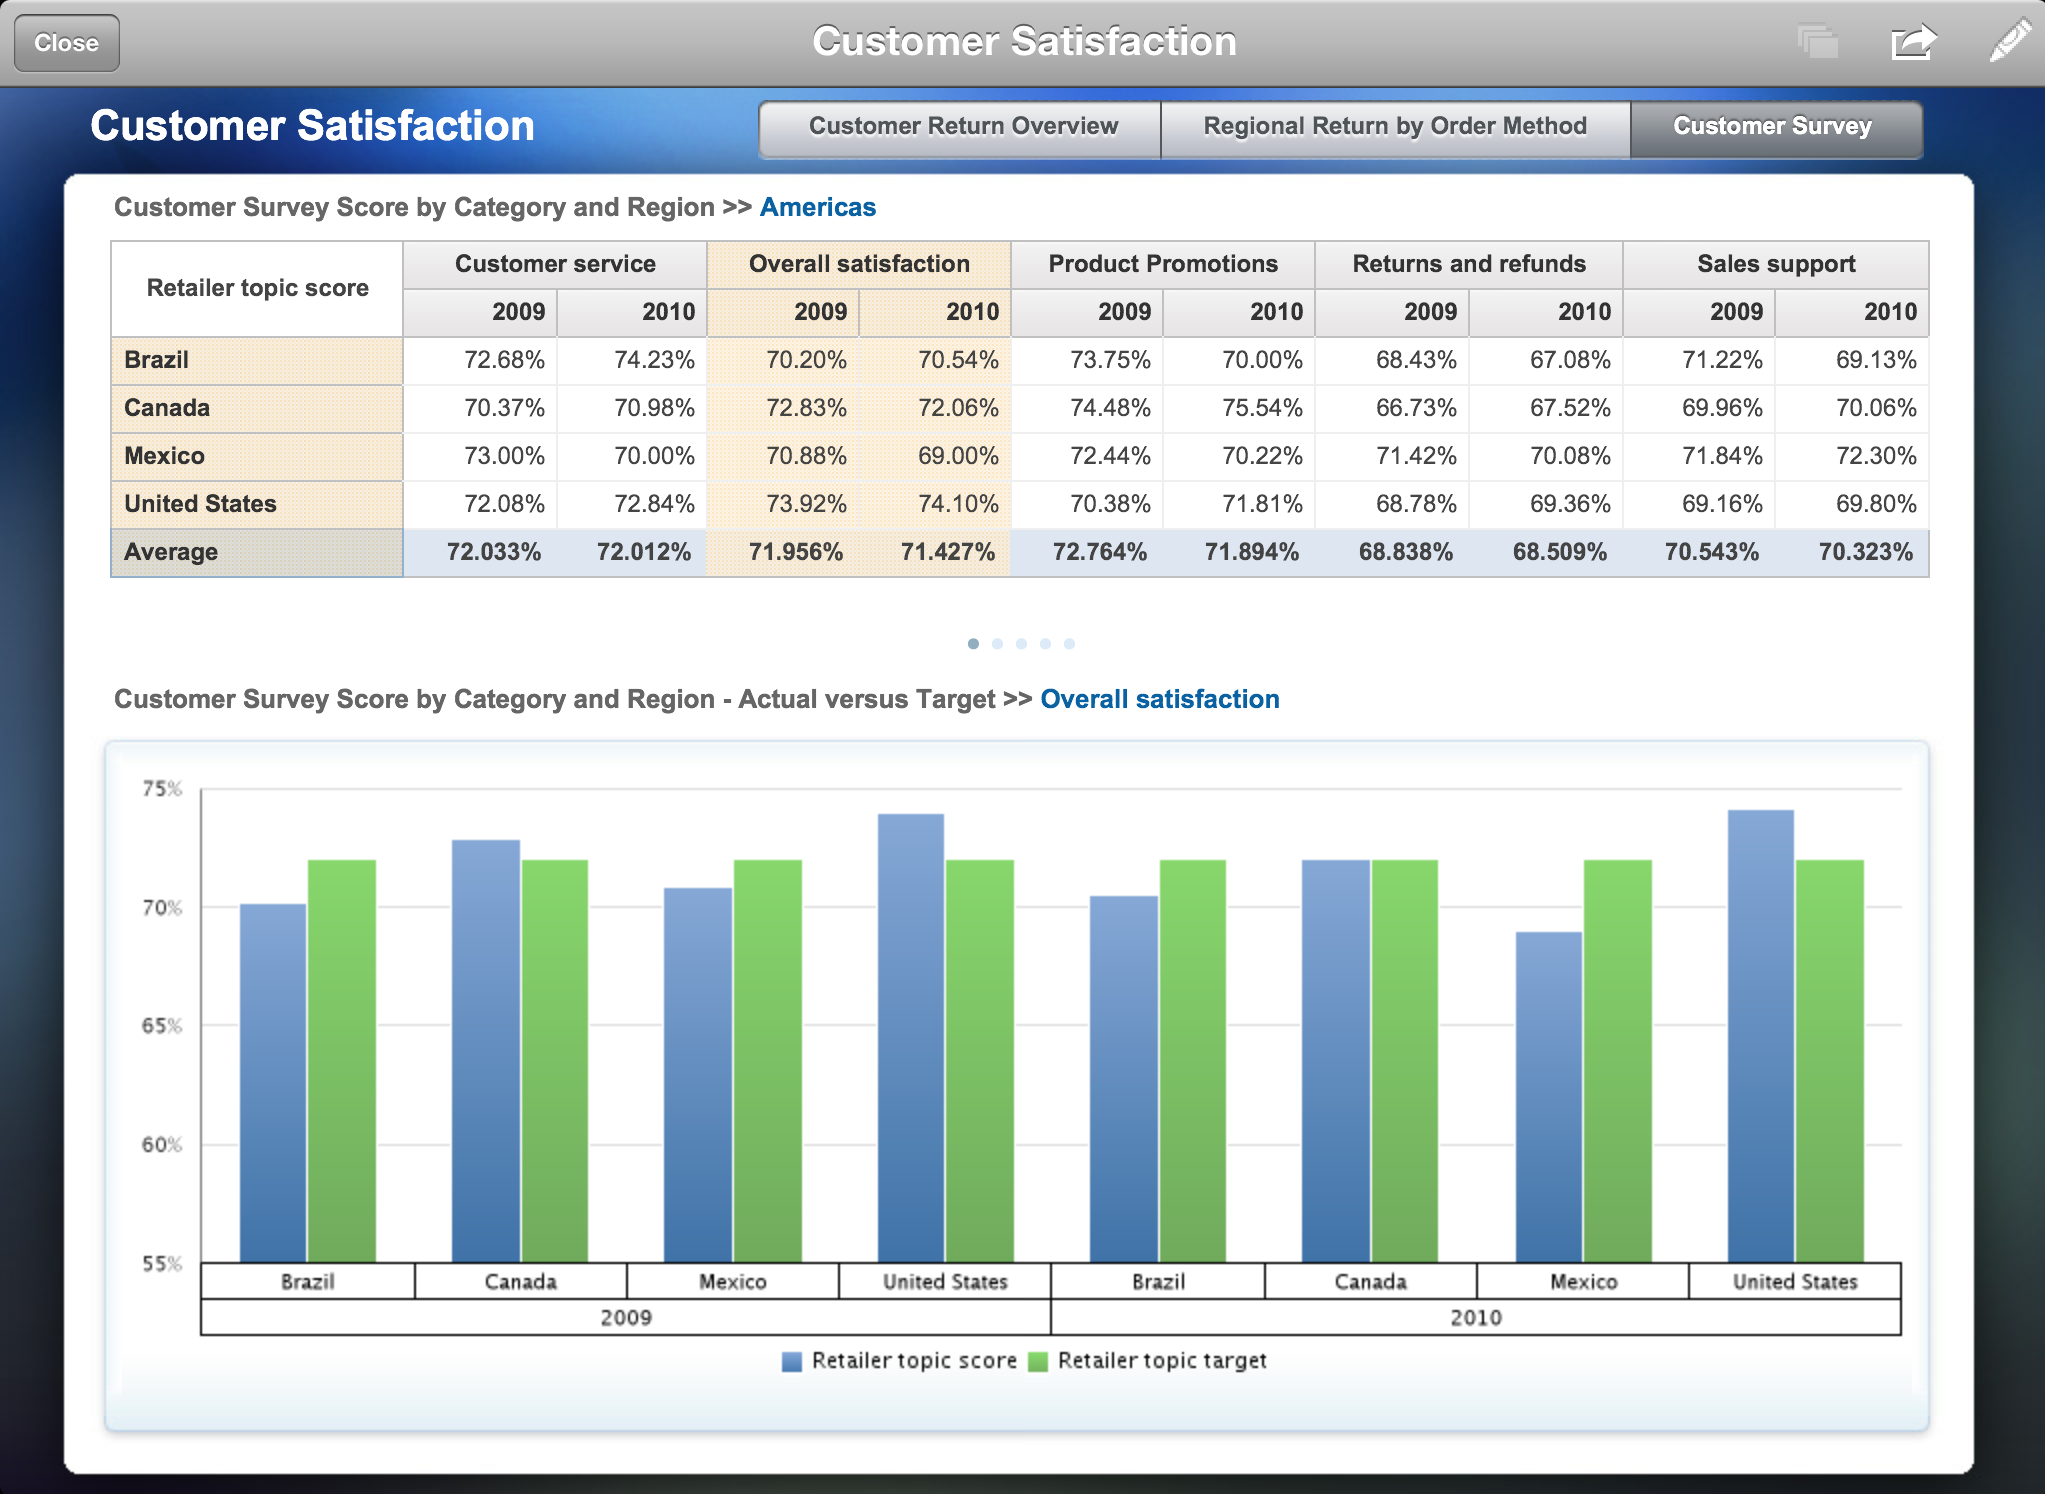
Several techniques and tools can be employed to create effective business intelligence reports. Choosing the right approach depends on your specific needs and the complexity of your data. Data warehousing is a foundational technique for consolidating data from multiple sources into a central repository, enabling comprehensive analysis. ETL (Extract, Transform, Load) processes are essential for cleaning, transforming, and loading data into a format suitable for reporting. Data visualization tools like Tableau, Power BI, and Qlik Sense provide interactive dashboards and visualizations that make data easier to understand. These tools allow users to explore data, identify trends, and drill down into specific details. Furthermore, SQL remains a vital skill for querying and manipulating data within databases.
Generating Sales Performance Reports
Sales performance reports are arguably one of the most common types of BI reports. These reports typically track key metrics such as revenue, sales volume, and average deal size. Sales trend analysis is a critical component of these reports, allowing businesses to identify patterns and trends in sales performance over time. Sales by region, product, and sales representative are common visualizations used to highlight areas of strength and weakness. Forecasting models can be integrated to predict future sales performance based on historical data and market trends. A well-designed sales report provides valuable insights for optimizing sales strategies and improving revenue targets. Consider incorporating customer segmentation to tailor reports to specific customer groups.
Tracking Marketing Campaign Effectiveness
Marketing campaign effectiveness is another key area for BI reporting. These reports track metrics such as lead generation, conversion rates, and return on investment (ROI) for marketing campaigns. Campaign performance dashboards provide a real-time view of campaign effectiveness, allowing marketers to quickly identify what’s working and what’s not. Attribution modeling is crucial for understanding which marketing channels are driving the most valuable customer acquisition. A/B testing results can be analyzed to optimize marketing messaging and improve conversion rates. Regularly reviewing campaign performance reports is essential for continuous improvement.

Monitoring Operational Efficiency
Operational efficiency reporting focuses on tracking key metrics related to business processes. This includes metrics such as production output, inventory levels, and customer service response times. Process performance dashboards visualize key process metrics, allowing managers to identify bottlenecks and areas for improvement. Root cause analysis tools can be used to investigate the underlying causes of operational issues. Predictive analytics can be applied to forecast potential operational disruptions and proactively address them. Understanding operational efficiency is vital for optimizing resource utilization and reducing costs.
Financial Reporting and Analysis
Financial reporting is a critical component of business intelligence, providing insights into profitability, cash flow, and financial performance. Profit and loss (P&L) reports track revenue, expenses, and net income. Balance sheets and cash flow statements provide a snapshot of the company’s financial position. Variance analysis identifies discrepancies between actual and budgeted figures. Key financial ratios (e.g., return on assets, debt-to-equity ratio) provide a benchmark for assessing financial health. Budget vs. actual reporting provides a clear view of performance against planned targets.
Leveraging BI Tools for Enhanced Insights
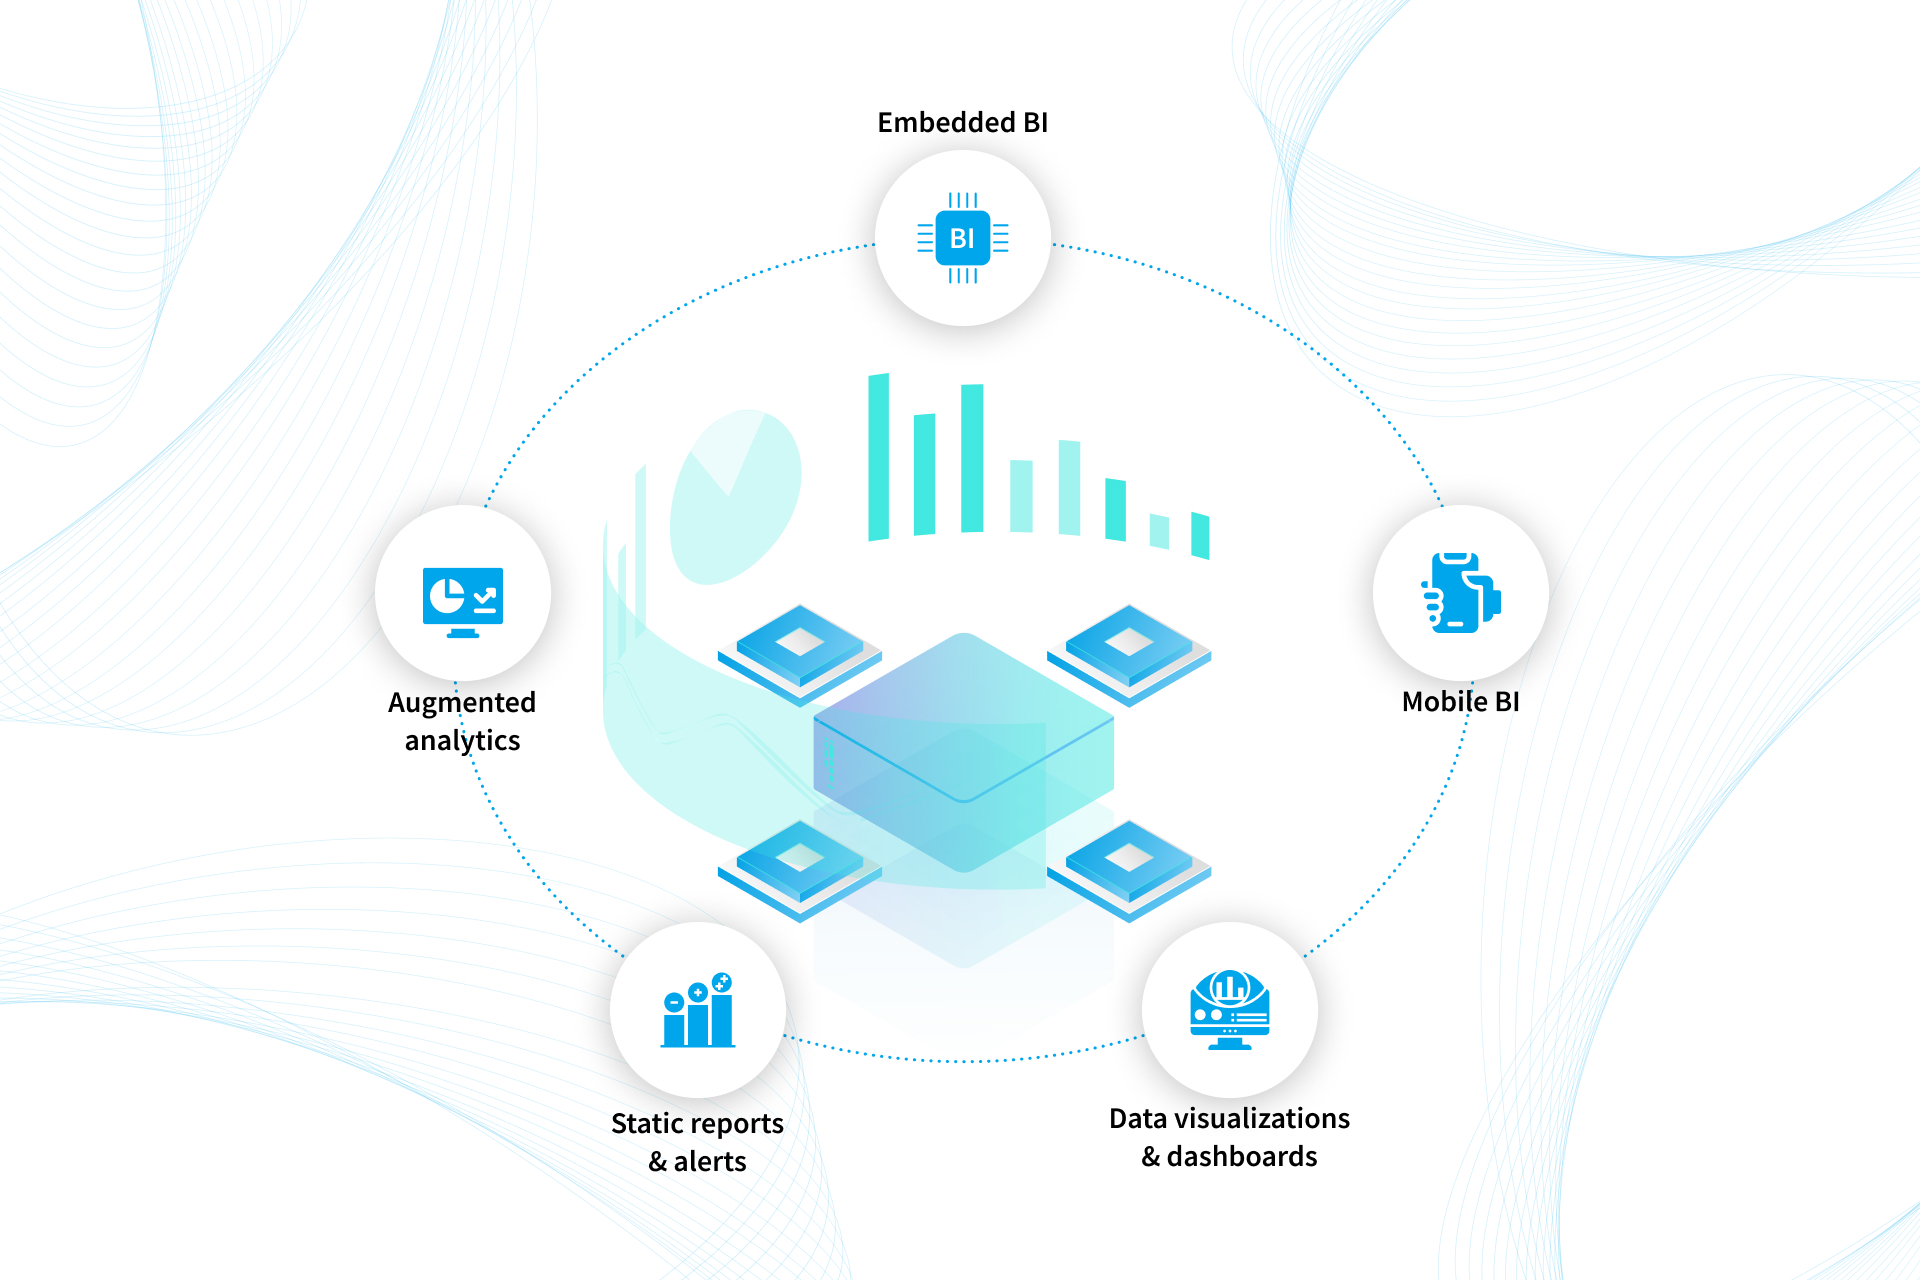
Beyond the basic reporting capabilities of standard BI tools, advanced features can significantly enhance the value of your data. Data visualization tools offer more sophisticated charting and dashboarding options, allowing for the creation of highly interactive and engaging reports. Predictive analytics tools can be used to forecast future trends and identify potential risks. Machine learning algorithms can be applied to uncover hidden patterns and insights in your data. Natural language processing (NLP) can be used to automatically extract insights from unstructured data sources. Choosing the right tools and techniques will depend on your specific needs and the complexity of your data.
Best Practices for Effective Business Intelligence Reporting
Several best practices can help ensure that your BI reports are effective and provide real value. Start with a clear understanding of your audience. Tailor your reports to the needs and interests of the intended audience. Focus on actionable insights. Avoid presenting data that is difficult to understand or interpret. Use clear and concise language. Avoid jargon and technical terms. Visualize your data effectively. Choose appropriate chart types to communicate your message. Regularly review and update your reports. Ensure that your reports are aligned with the overall business strategy. Ensure data quality. Invest in data governance and data quality management. Automate reporting processes. Streamline the reporting process to reduce manual effort and improve efficiency. Seek feedback from users. Solicit feedback from stakeholders to identify areas for improvement.
Conclusion
Business intelligence reporting is no longer a luxury – it’s a strategic imperative. By implementing robust reporting strategies, leveraging the right tools, and adhering to best practices, organizations can unlock the full potential of their data and drive significant business value. The ability to translate raw data into actionable insights is the key to informed decision-making, improved operational efficiency, and sustained competitive advantage. As data continues to grow in volume and complexity, the demand for skilled BI professionals will only increase. Investing in BI capabilities is an investment in the future of your organization. Ultimately, successful business intelligence reporting is about empowering stakeholders with the knowledge they need to succeed.