The modern business landscape is increasingly data-driven. Companies are swimming in information, but simply collecting data isn’t enough; they need to understand what to do with it, how to use it, and how to share it effectively. This is where business intelligence (BI) reporting tools come in. These tools are the key to unlocking valuable insights from your data, enabling informed decision-making across all levels of an organization. Business intelligence reporting tools are no longer a luxury; they are a necessity for companies striving for competitive advantage. This article will delve into the world of BI reporting tools, exploring their different types, benefits, and how to choose the right one for your specific needs.
What is Business Intelligence?

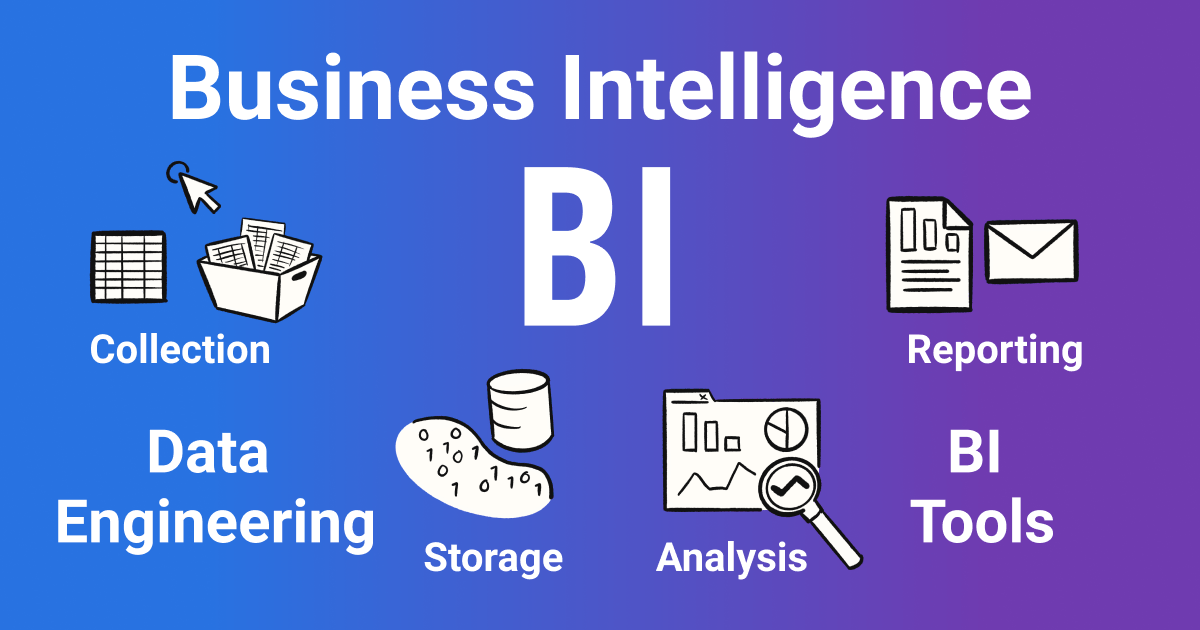
Before we dive into the tools themselves, let’s define what business intelligence is. It’s a strategic process of collecting, analyzing, and visualizing data to support business decisions. It’s about moving beyond simply tracking metrics to understanding why they’re changing and what actions to take based on those insights. It’s a cyclical process – collecting data, analyzing it, and then using the results to refine strategies and improve performance. A core component of BI is the ability to transform raw data into actionable intelligence. This often involves techniques like data mining, statistical analysis, and predictive modeling. Ultimately, BI aims to provide a clear and concise view of the business, allowing stakeholders to make smarter choices.
Types of Business Intelligence Reporting Tools
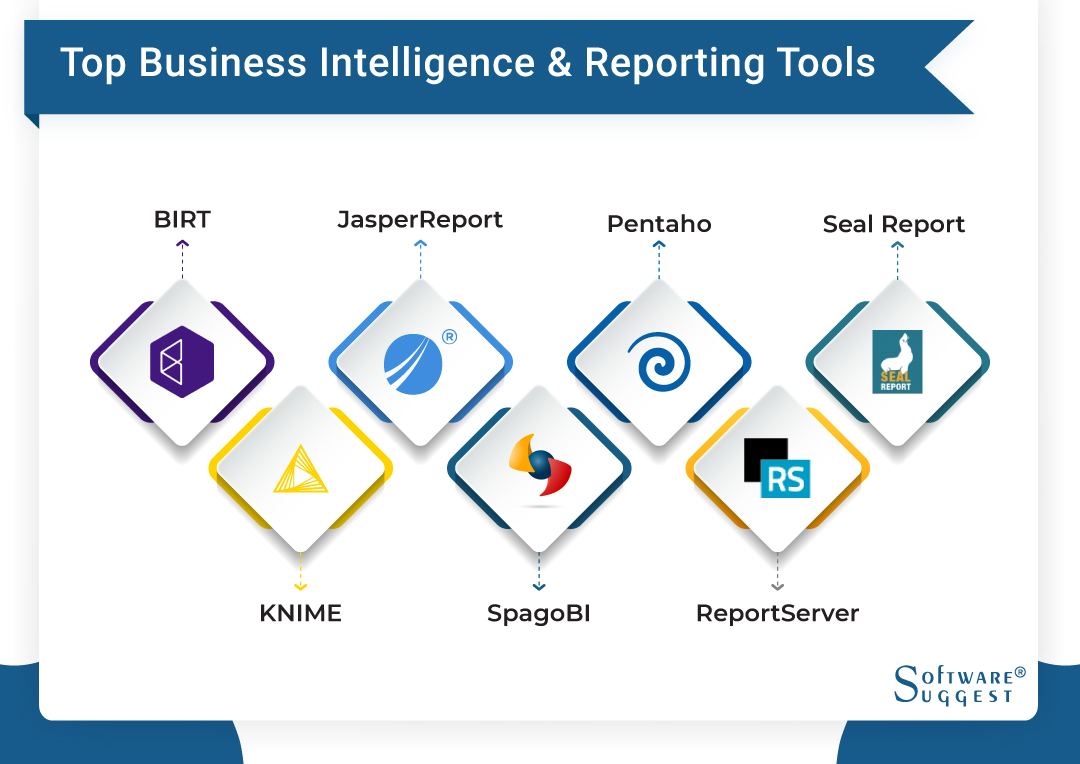
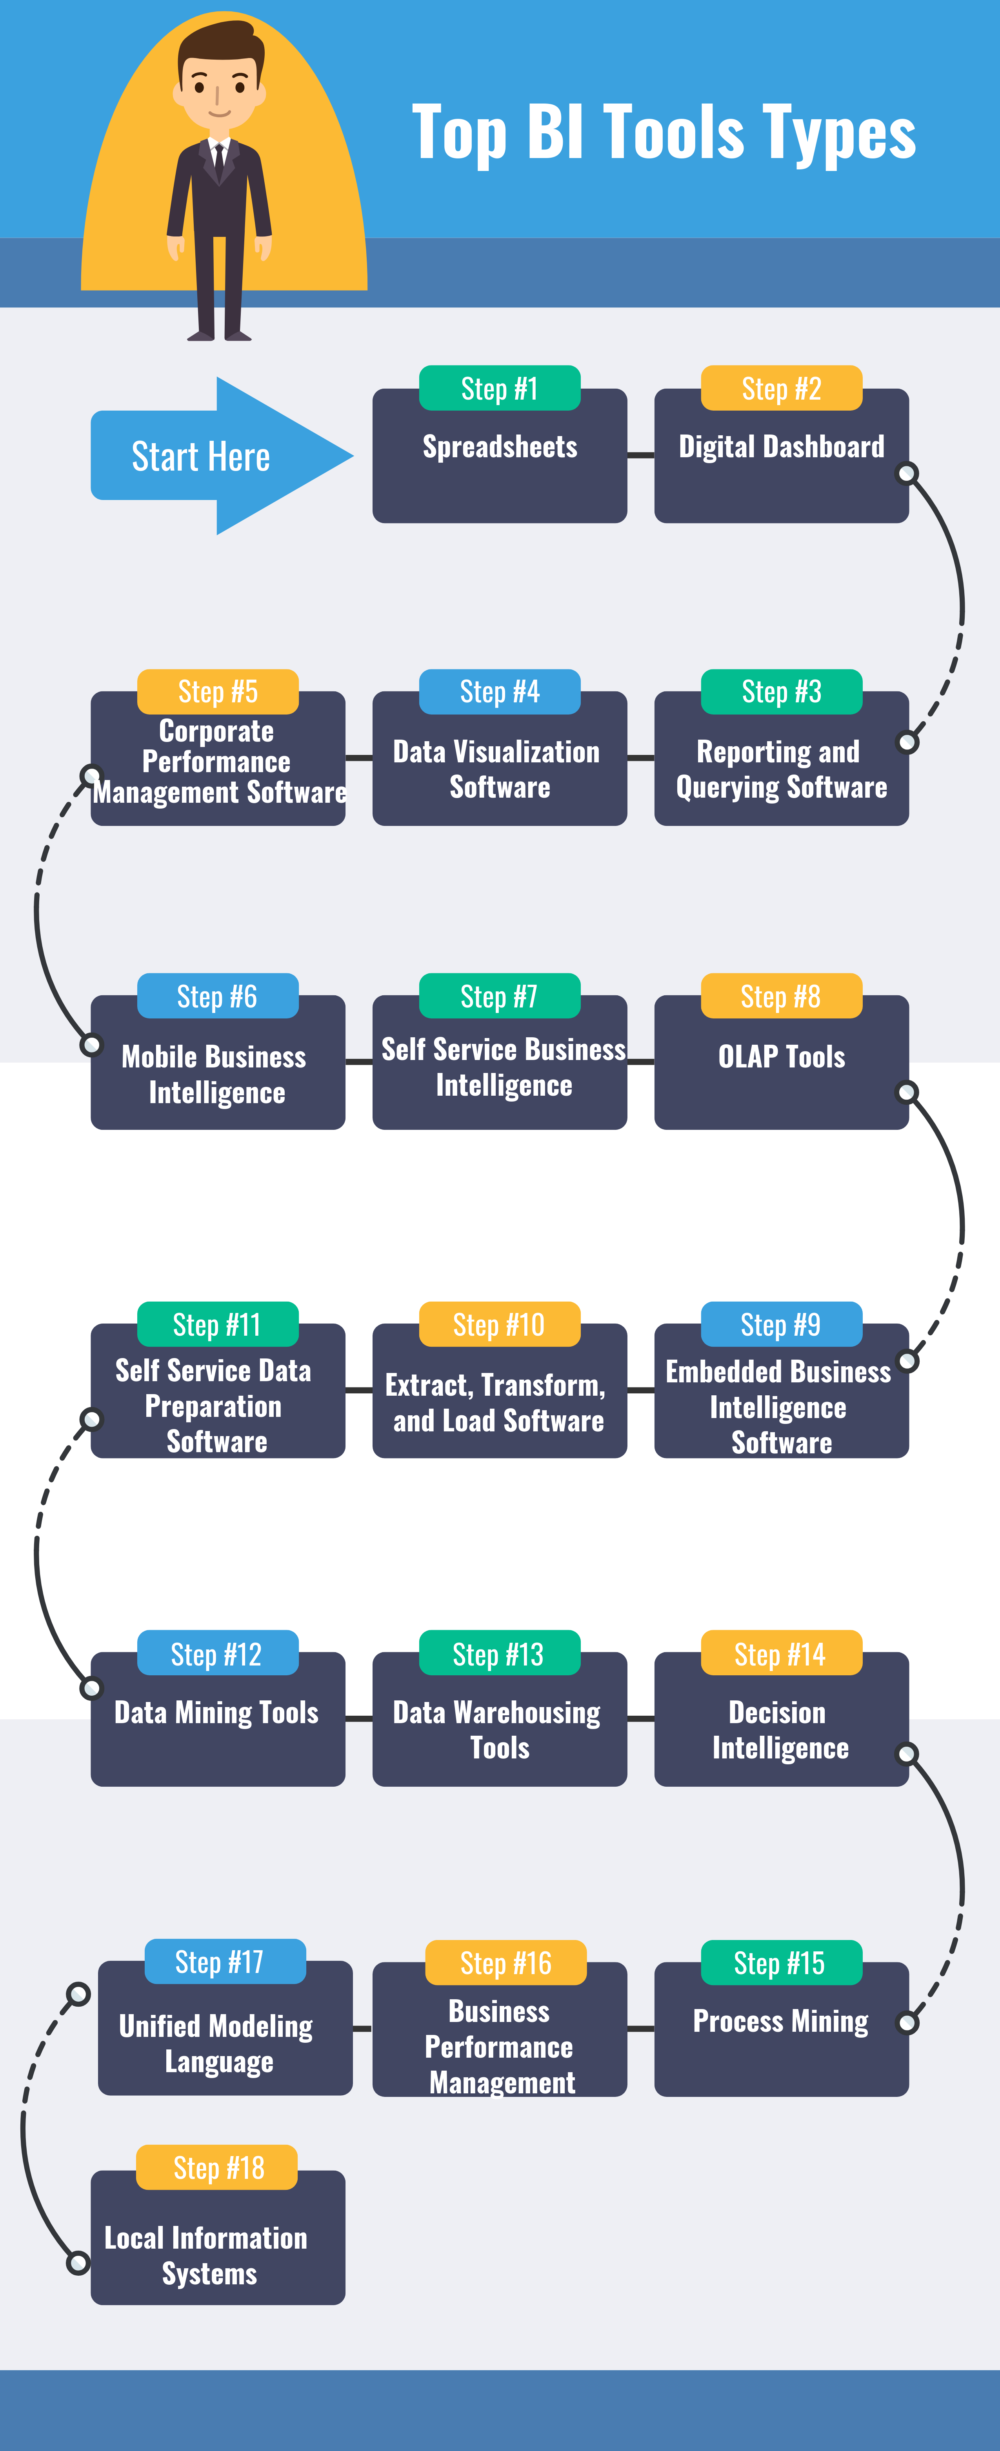
There’s a wide variety of BI reporting tools available, each with its own strengths and weaknesses. Choosing the right tool depends heavily on your organization’s size, industry, and specific reporting needs. Here’s a breakdown of some of the most popular types:
Spreadsheet-Based Tools: These are often the starting point for many businesses. Tools like Microsoft Excel and Google Sheets offer basic reporting capabilities, allowing users to create charts, graphs, and pivot tables to analyze data. While affordable, they can become cumbersome for complex analyses and often lack advanced features.
Business Intelligence Platforms (BI Platforms): These are comprehensive solutions designed for larger organizations. Examples include Tableau, Power BI, and Qlik Sense. They offer a wider range of features, including data visualization, data integration, and advanced analytics. They typically require a subscription fee and a steeper learning curve.
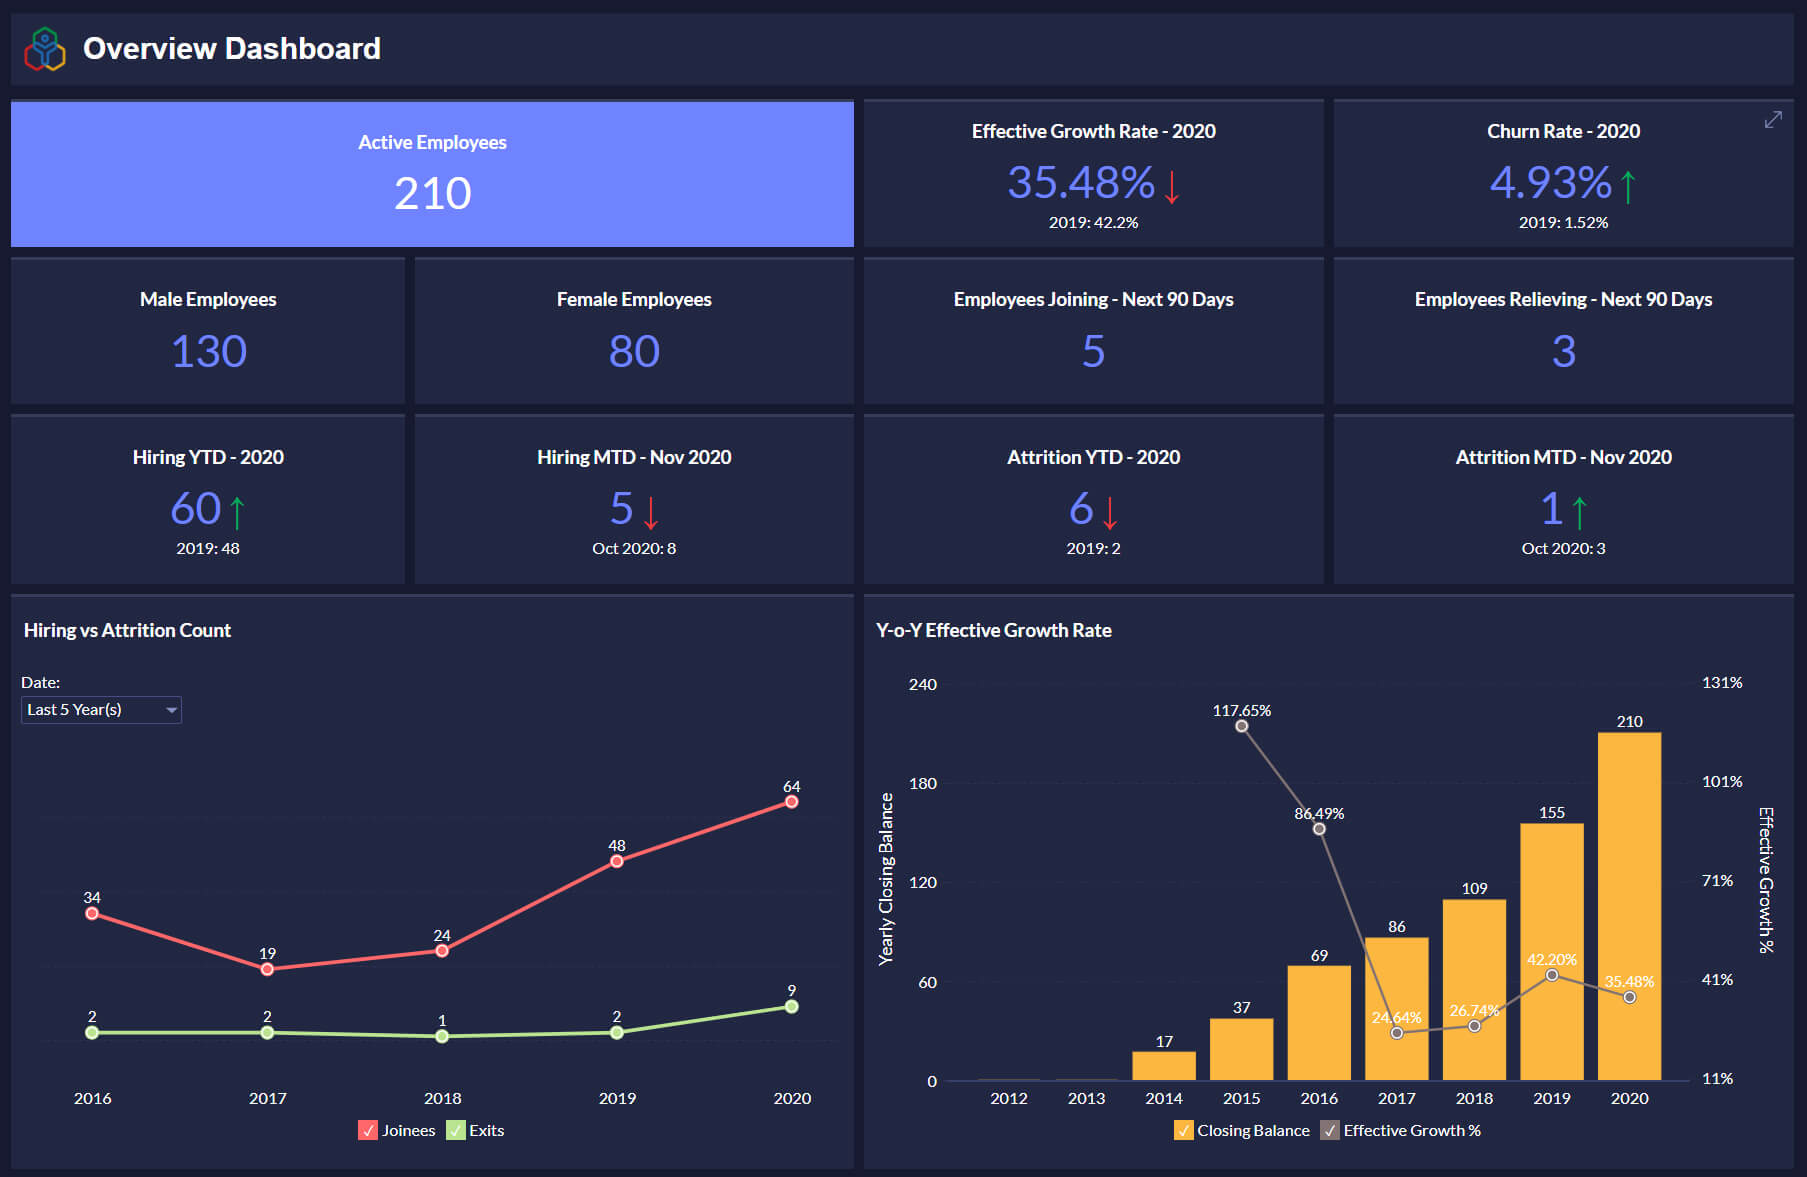
Data Visualization Tools: Tools like Looker and Domo focus specifically on creating interactive dashboards and visualizations. They excel at presenting data in a visually appealing and easily understandable format. They often integrate well with other data sources.
Cloud-Based BI Tools: Services like Amazon QuickSight, Google Data Studio, and Microsoft Power BI Service provide a scalable and accessible way to analyze data. They are often easier to deploy and manage than on-premise solutions.
Benefits of Implementing Business Intelligence Reporting Tools
Investing in a BI reporting tool can yield significant benefits for your organization. Here are some key advantages:
Improved Decision-Making: By providing real-time insights, BI tools empower decision-makers to make more informed choices, reducing reliance on gut feelings.
Increased Efficiency: Automated reporting eliminates the need for manual data collection and analysis, freeing up valuable time for employees to focus on strategic initiatives.
Enhanced Operational Performance: Tracking key performance indicators (KPIs) allows businesses to identify areas for improvement and optimize their operations.
Better Customer Understanding: BI tools can analyze customer data to gain a deeper understanding of their needs and preferences, leading to improved customer service and targeted marketing campaigns.
Competitive Advantage: By identifying trends and opportunities, businesses can gain a competitive edge in their respective markets.
Data-Driven Culture: The adoption of BI tools fosters a data-driven culture within the organization, encouraging employees to embrace data as a valuable asset.
Key Features to Look for in a Business Intelligence Reporting Tool
When evaluating BI reporting tools, consider the following features:
Data Connectivity: Can the tool connect to your existing data sources (e.g., databases, CRM systems, spreadsheets)?
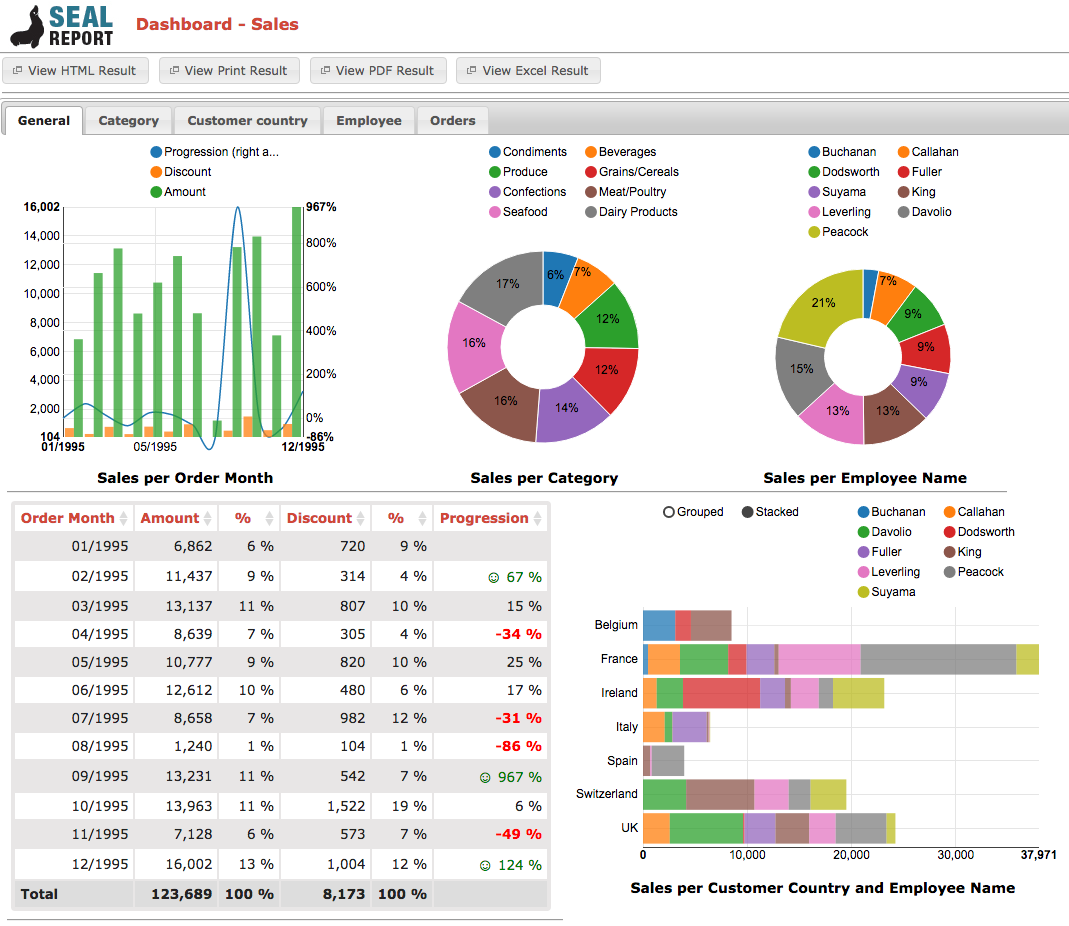
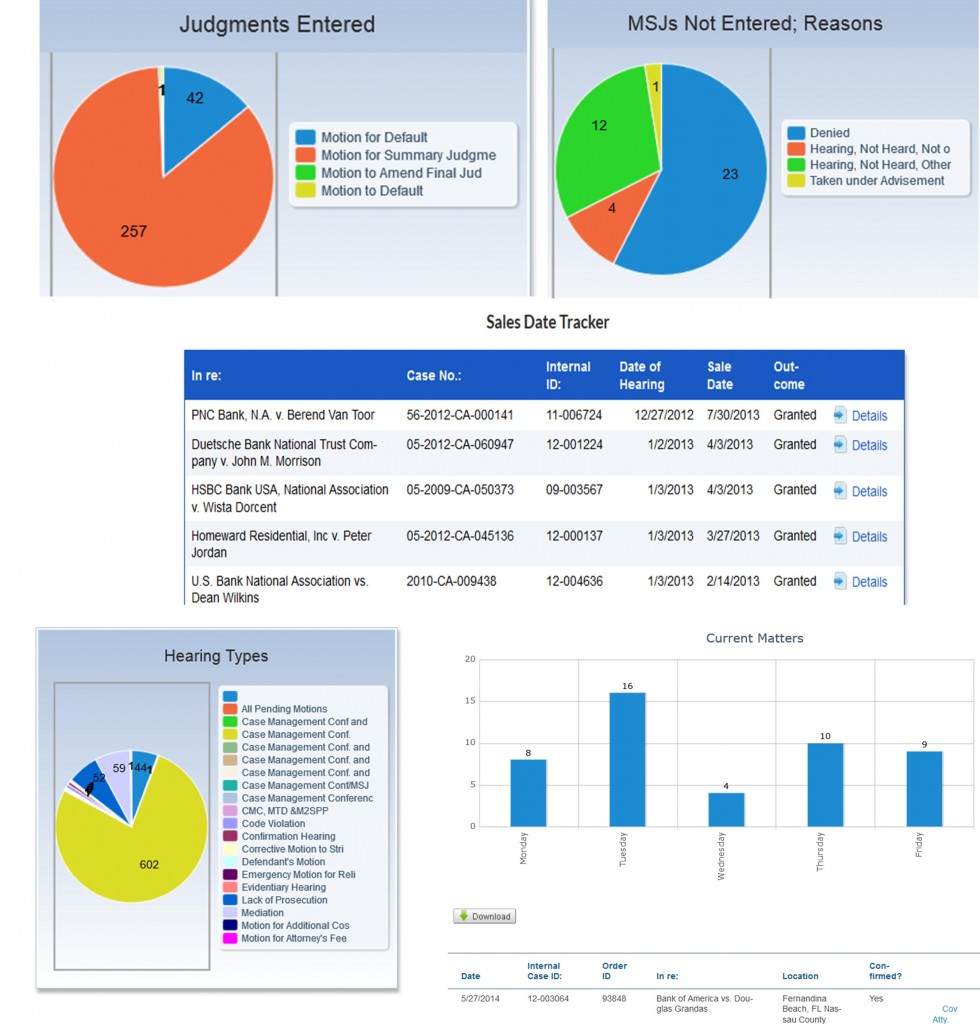
Data Visualization Capabilities: Does the tool offer a variety of chart types and interactive dashboards?
Data Transformation & ETL: Can the tool handle data cleaning, transformation, and loading (ETL) processes?
Collaboration Features: Does the tool allow multiple users to collaborate on reports and dashboards?
Security & Access Control: Does the tool offer robust security features to protect sensitive data?
Scalability: Can the tool handle growing data volumes and user demands?
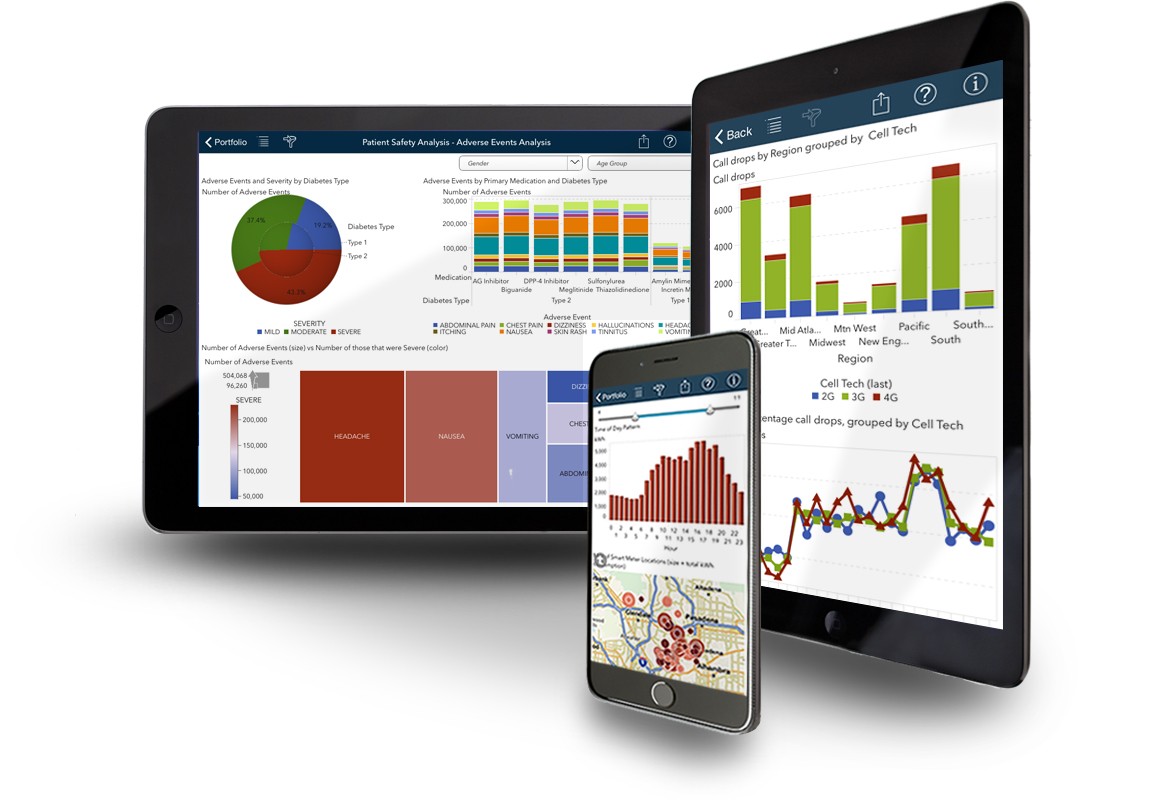
Mobile Access: Can users access reports and dashboards from mobile devices?
Specific Use Cases for Business Intelligence Reporting
BI reporting tools are applicable across a wide range of industries and business functions. Here are a few examples:
Sales & Marketing: Tracking sales performance, analyzing marketing campaign effectiveness, and identifying customer segments.
Finance: Monitoring financial performance, managing budgets, and identifying cost savings.
Operations: Analyzing production efficiency, tracking inventory levels, and optimizing supply chains.
Human Resources: Analyzing employee performance, identifying training needs, and managing talent acquisition.
Retail: Analyzing sales trends, optimizing product placement, and improving customer experience.
Challenges and Considerations When Implementing BI
While BI reporting tools offer numerous benefits, there are also some challenges to consider:
Data Quality: The accuracy and completeness of your data are crucial for generating reliable insights. Poor data quality can lead to misleading results.
Data Governance: Establishing clear data governance policies is essential to ensure data consistency and compliance.
Skills Gap: Implementing and utilizing BI tools effectively requires specialized skills, such as data analysis, visualization, and reporting.
Change Management: Successfully adopting BI requires a change in mindset and a commitment to data-driven decision-making.
Cost: The cost of BI tools and implementation can vary significantly depending on the chosen solution and the size of your organization.
Conclusion
Business intelligence reporting tools are indispensable for organizations seeking to unlock the value of their data. By providing a clear and accessible view of key business metrics, these tools empower decision-makers to make more informed choices, improve operational performance, and gain a competitive advantage. Choosing the right tool, investing in data quality, and fostering a data-driven culture are crucial for realizing the full potential of BI. As data continues to grow in volume and complexity, the importance of robust BI reporting tools will only continue to increase. Ultimately, embracing BI reporting empowers businesses to thrive in today’s dynamic and data-rich environment.