Data analysis techniques are no longer a niche skill; they’re becoming a fundamental requirement across virtually every industry. From marketing and finance to healthcare and scientific research, organizations are drowning in data, and the ability to extract meaningful insights is paramount to success. Understanding and applying these techniques is no longer optional; it’s a strategic imperative. This article will provide a comprehensive overview of various data analysis techniques, equipping you with the knowledge to effectively leverage data for informed decision-making. Let’s dive in.
The Rise of Data-Driven Decision Making
The exponential growth of data in recent years has fundamentally shifted how businesses operate. Traditional methods of reporting and analysis are simply insufficient to handle the volume and variety of information. Companies are now relying on data to understand customer behavior, optimize operations, predict trends, and identify new opportunities. This shift necessitates a proactive approach to data collection, storage, and analysis. The traditional ‘gut feeling’ approach is becoming increasingly obsolete, replaced by a data-driven methodology. The ability to transform raw data into actionable intelligence is what separates successful organizations from those that fall behind. This fundamental change has spurred a massive demand for skilled data analysts and data scientists. Ignoring this trend is a significant risk, potentially leading to missed opportunities and reduced competitiveness. The focus is now squarely on harnessing the power of data to drive strategic advantage.

Core Data Analysis Techniques
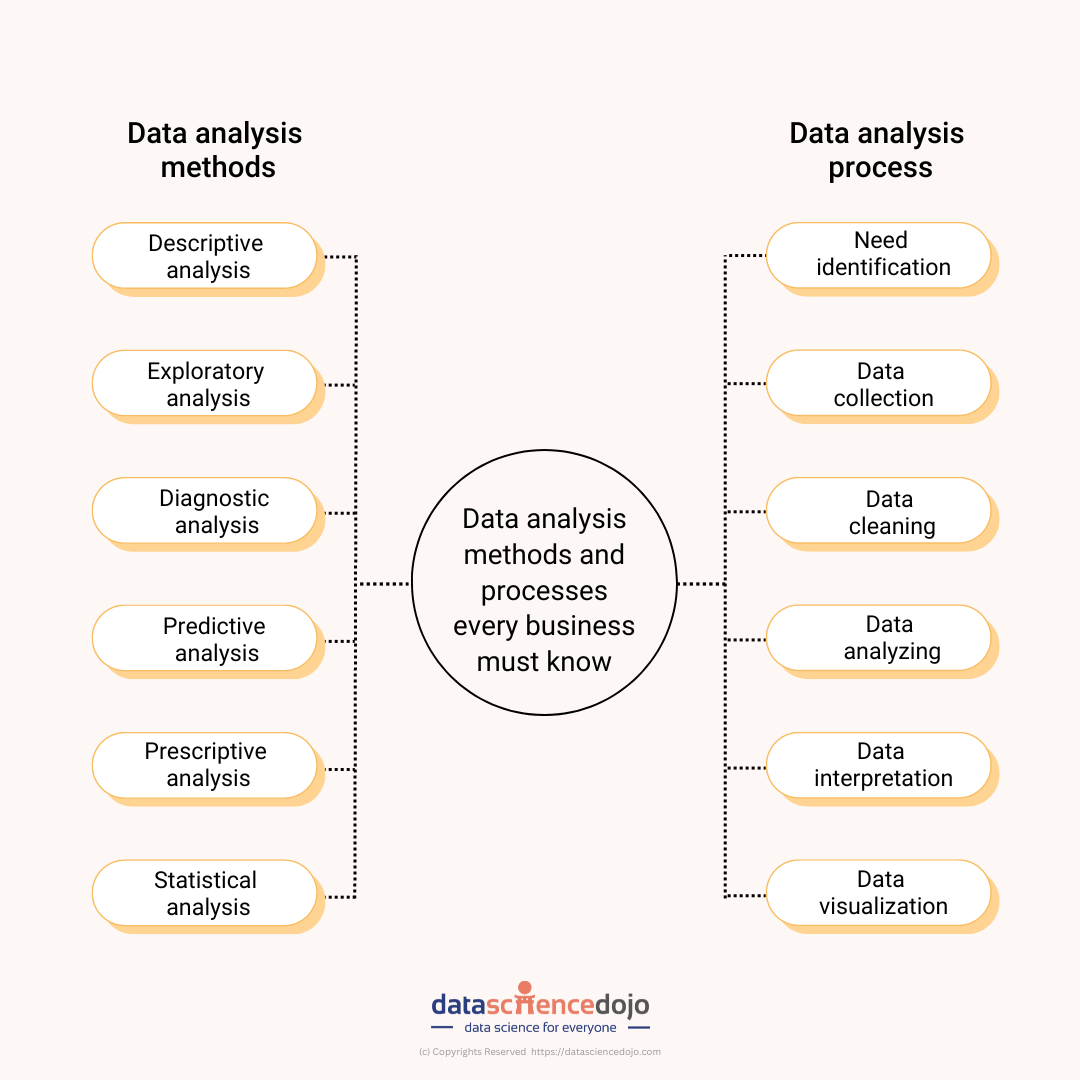
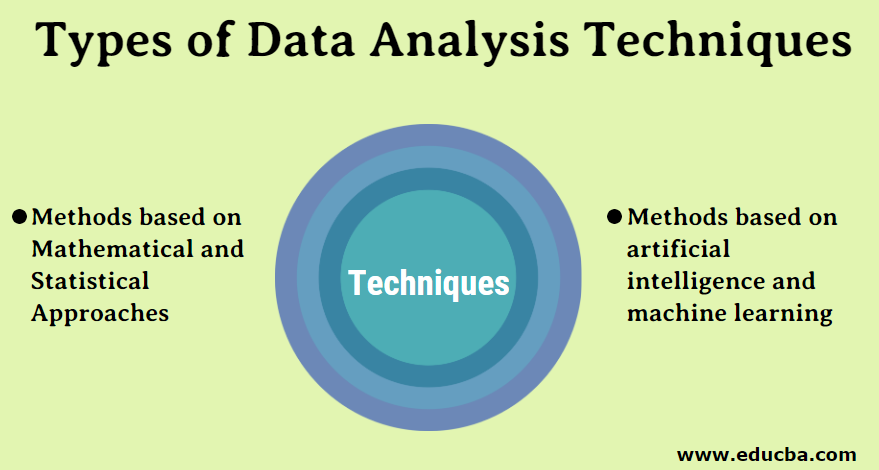
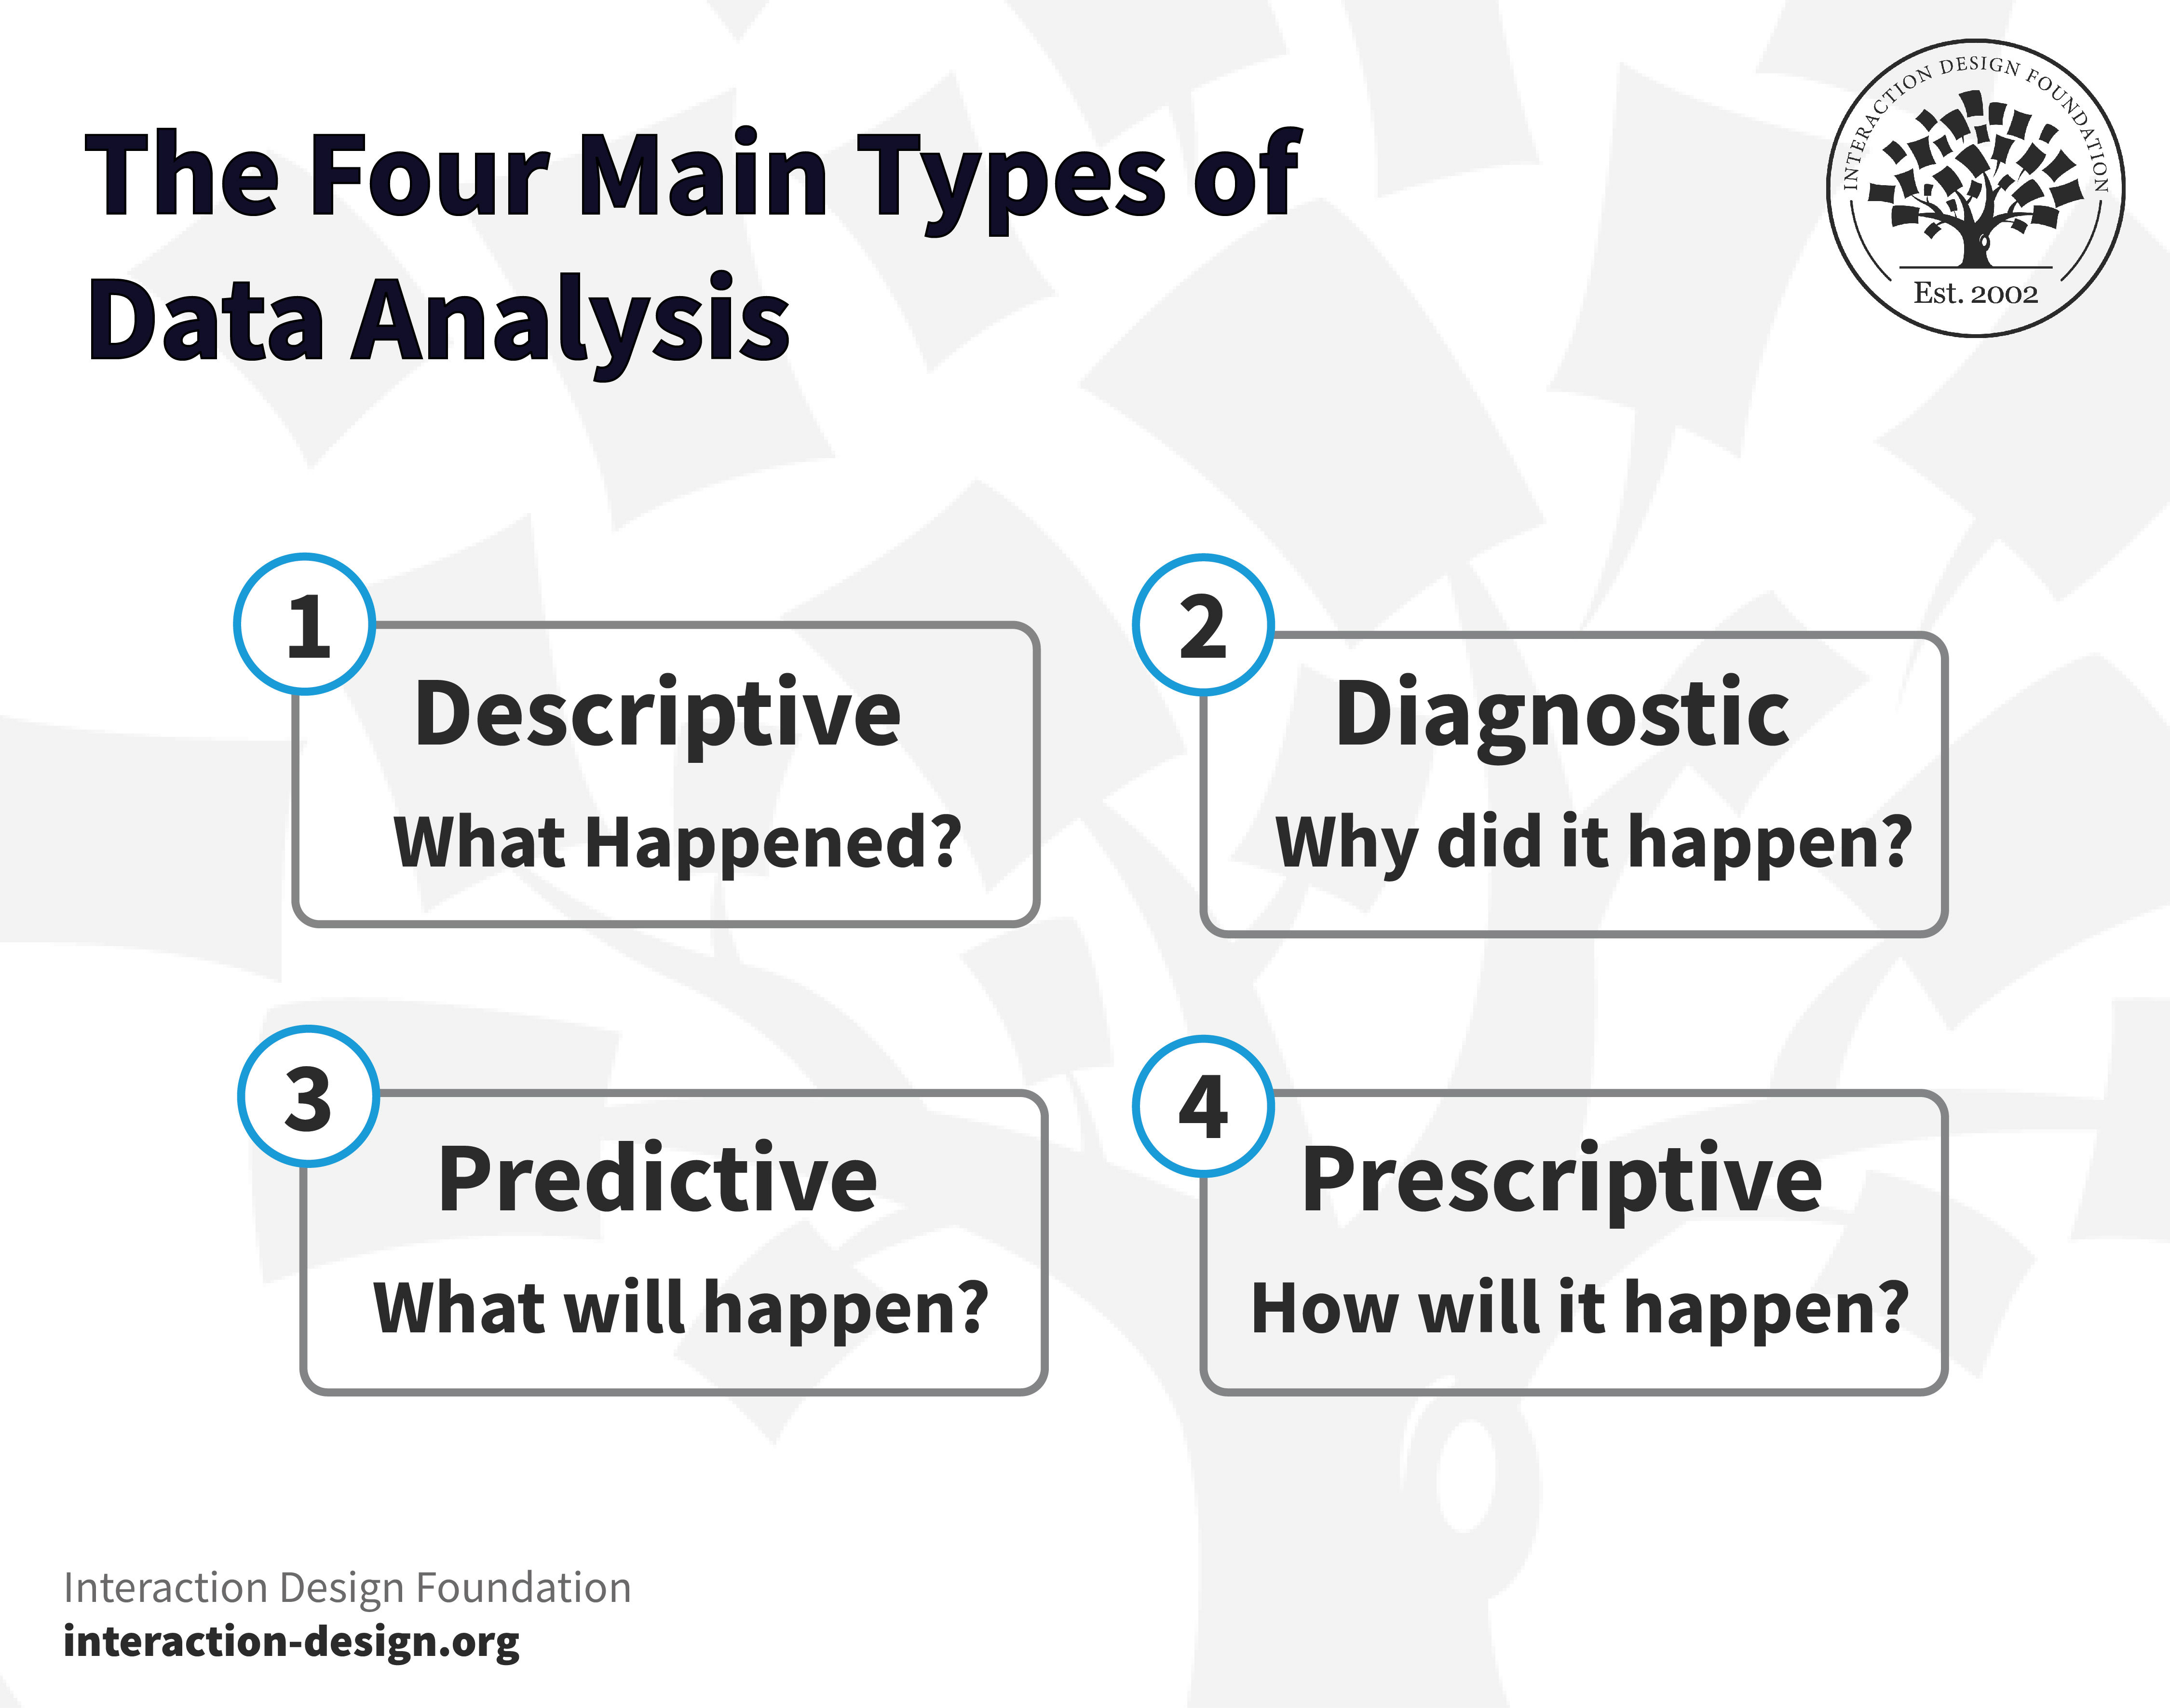
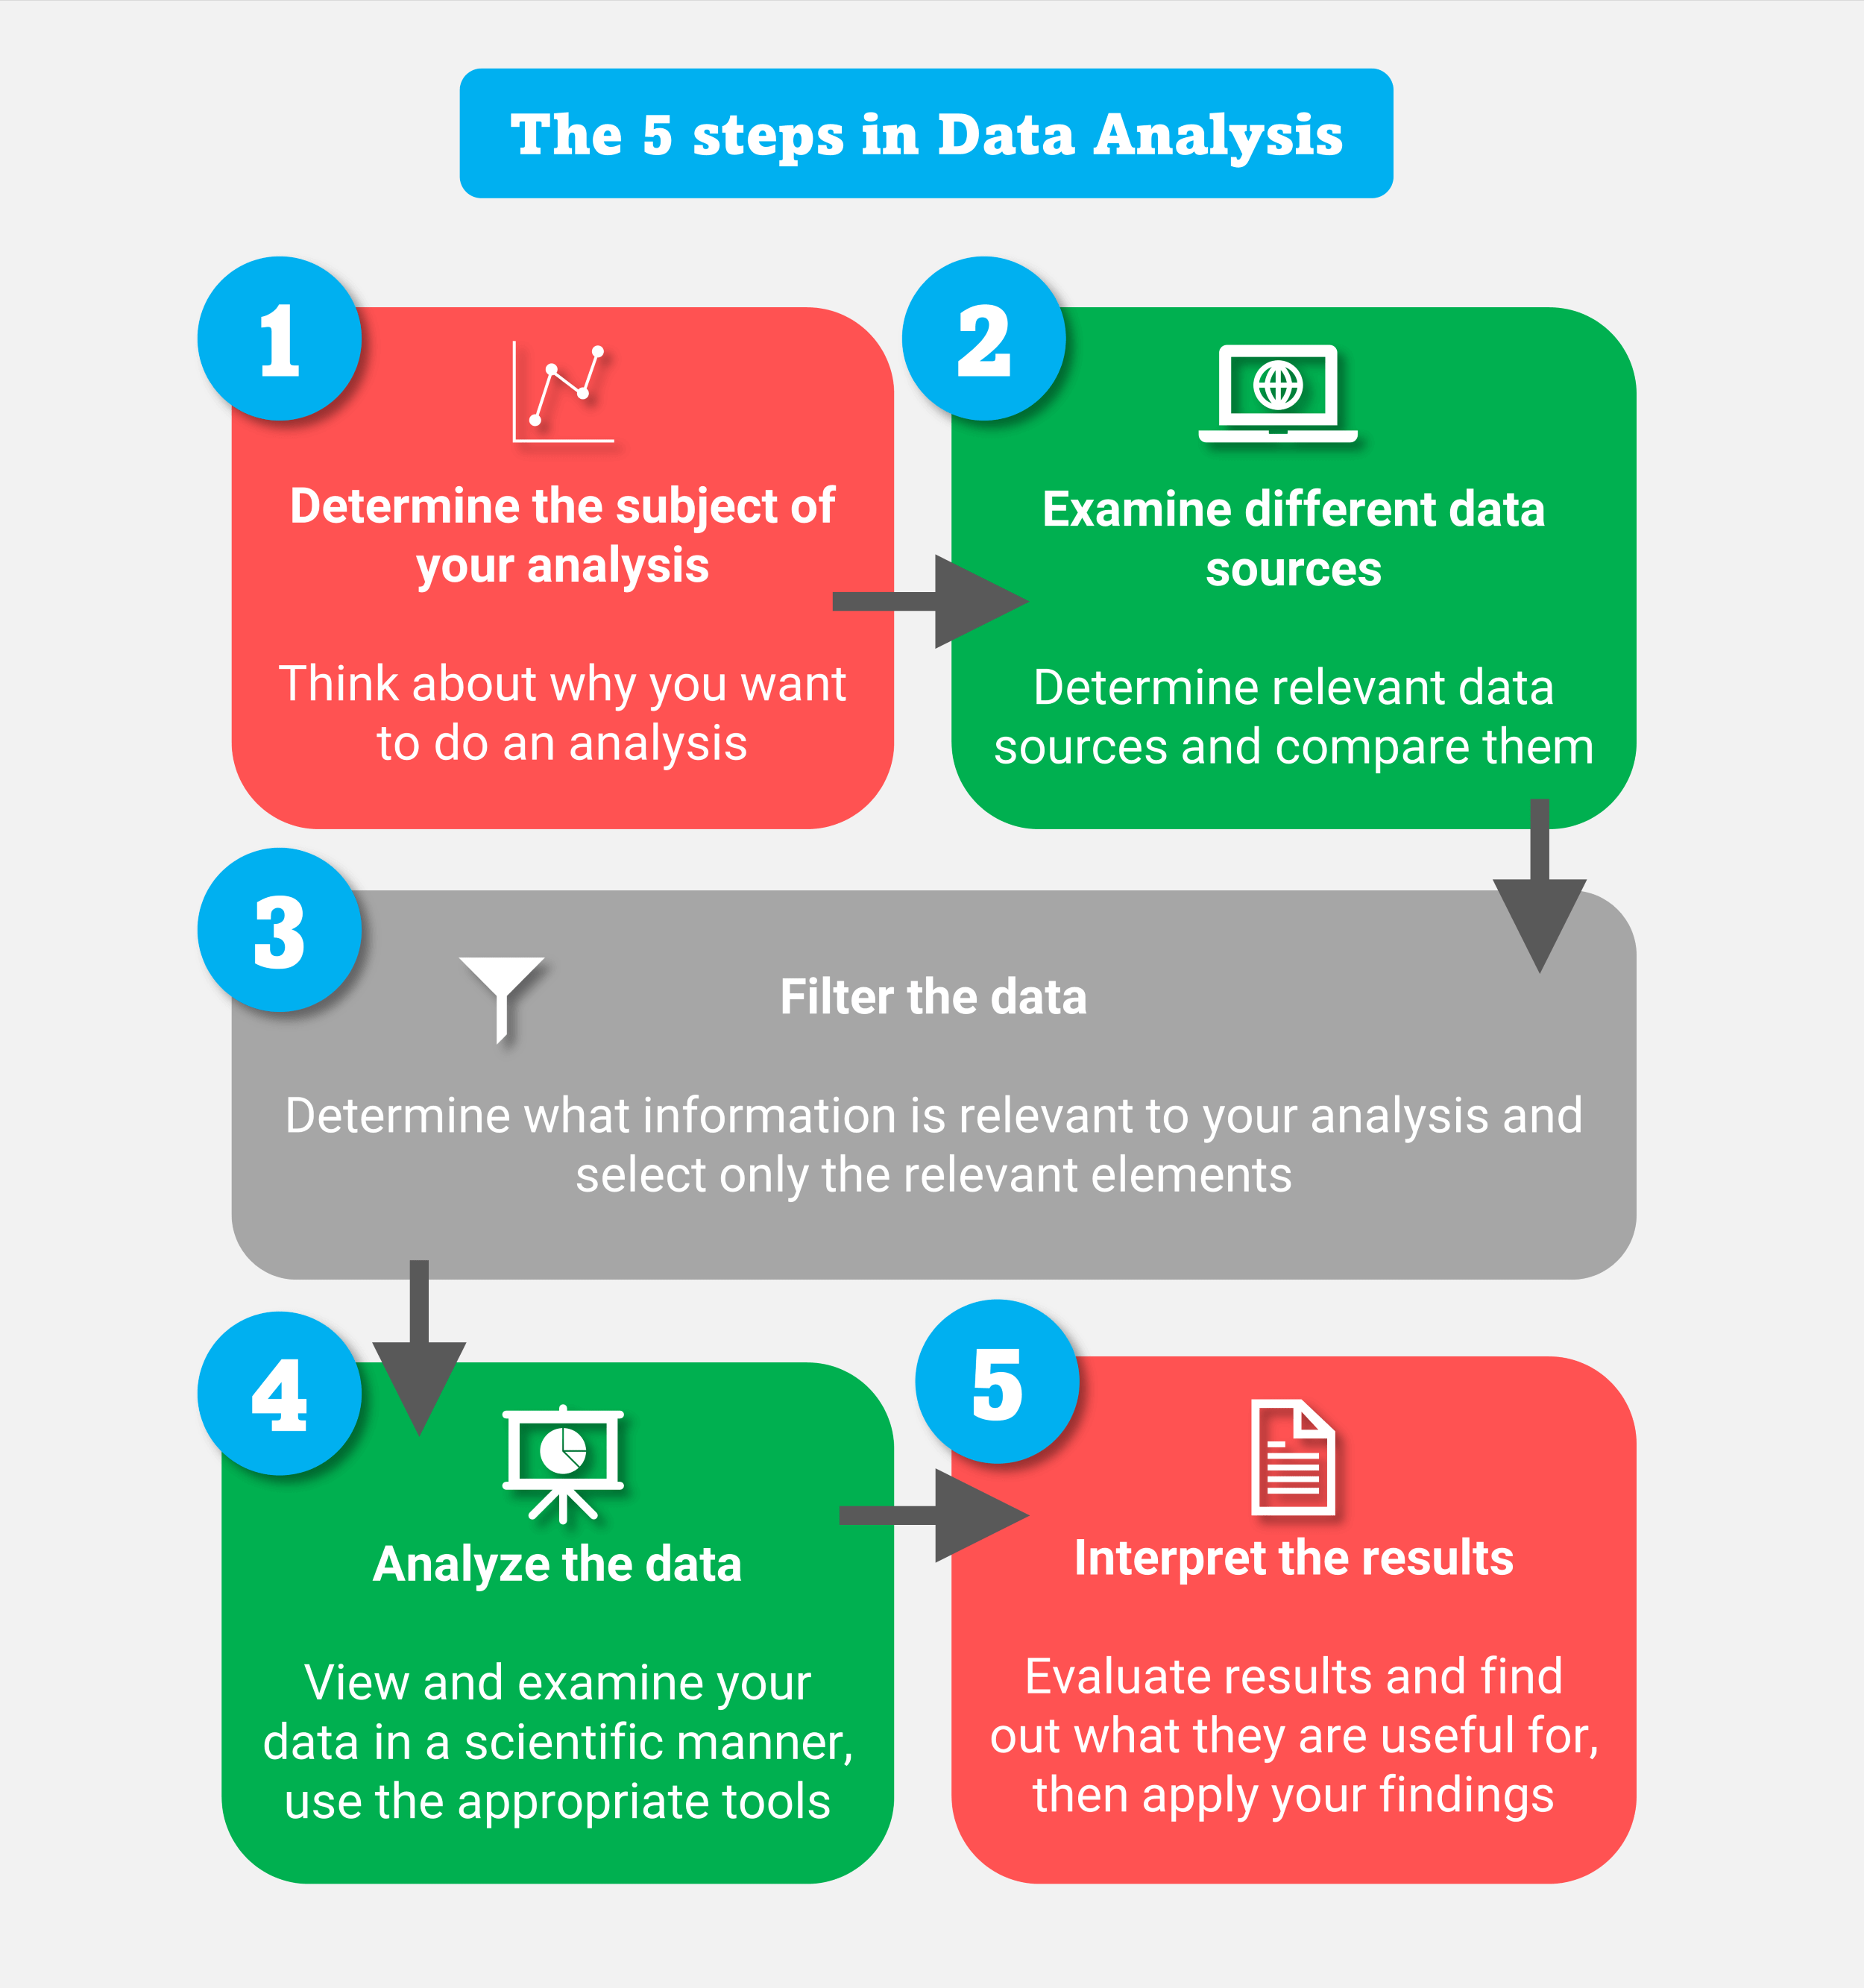
There’s a wide spectrum of data analysis techniques, each suited for different types of data and analytical goals. Let’s explore some of the most commonly employed methods:
Descriptive Statistics
Before diving into more complex techniques, it’s crucial to understand descriptive statistics. These techniques summarize and describe the main features of a dataset. Descriptive statistics provide a snapshot of the data, revealing its central tendencies, spread, and distribution. Common measures include mean, median, mode, standard deviation, and percentiles. Tools like spreadsheets (Excel, Google Sheets) and statistical software packages (R, Python with Pandas) are invaluable for generating these summaries. Understanding these basic measures allows you to quickly identify patterns and outliers within your data. For example, examining the mean age of customers in a demographic dataset can reveal valuable insights into your target market. Furthermore, calculating the frequency distribution of different values helps to understand the distribution of the data.
Data Visualization
Visualizing data is a powerful way to uncover hidden patterns and trends that might be missed when looking at raw numbers. Data visualization transforms complex datasets into easily understandable charts and graphs. Different chart types – bar charts, line graphs, scatter plots, histograms – each communicate a different type of information. Choosing the right chart type is crucial for effective communication. For example, a line graph can show trends over time, while a bar chart can compare values across different categories. Tools like Tableau, Power BI, and Python libraries like Matplotlib and Seaborn are commonly used for creating compelling visualizations. Interactive dashboards allow users to explore the data themselves, further enhancing understanding.

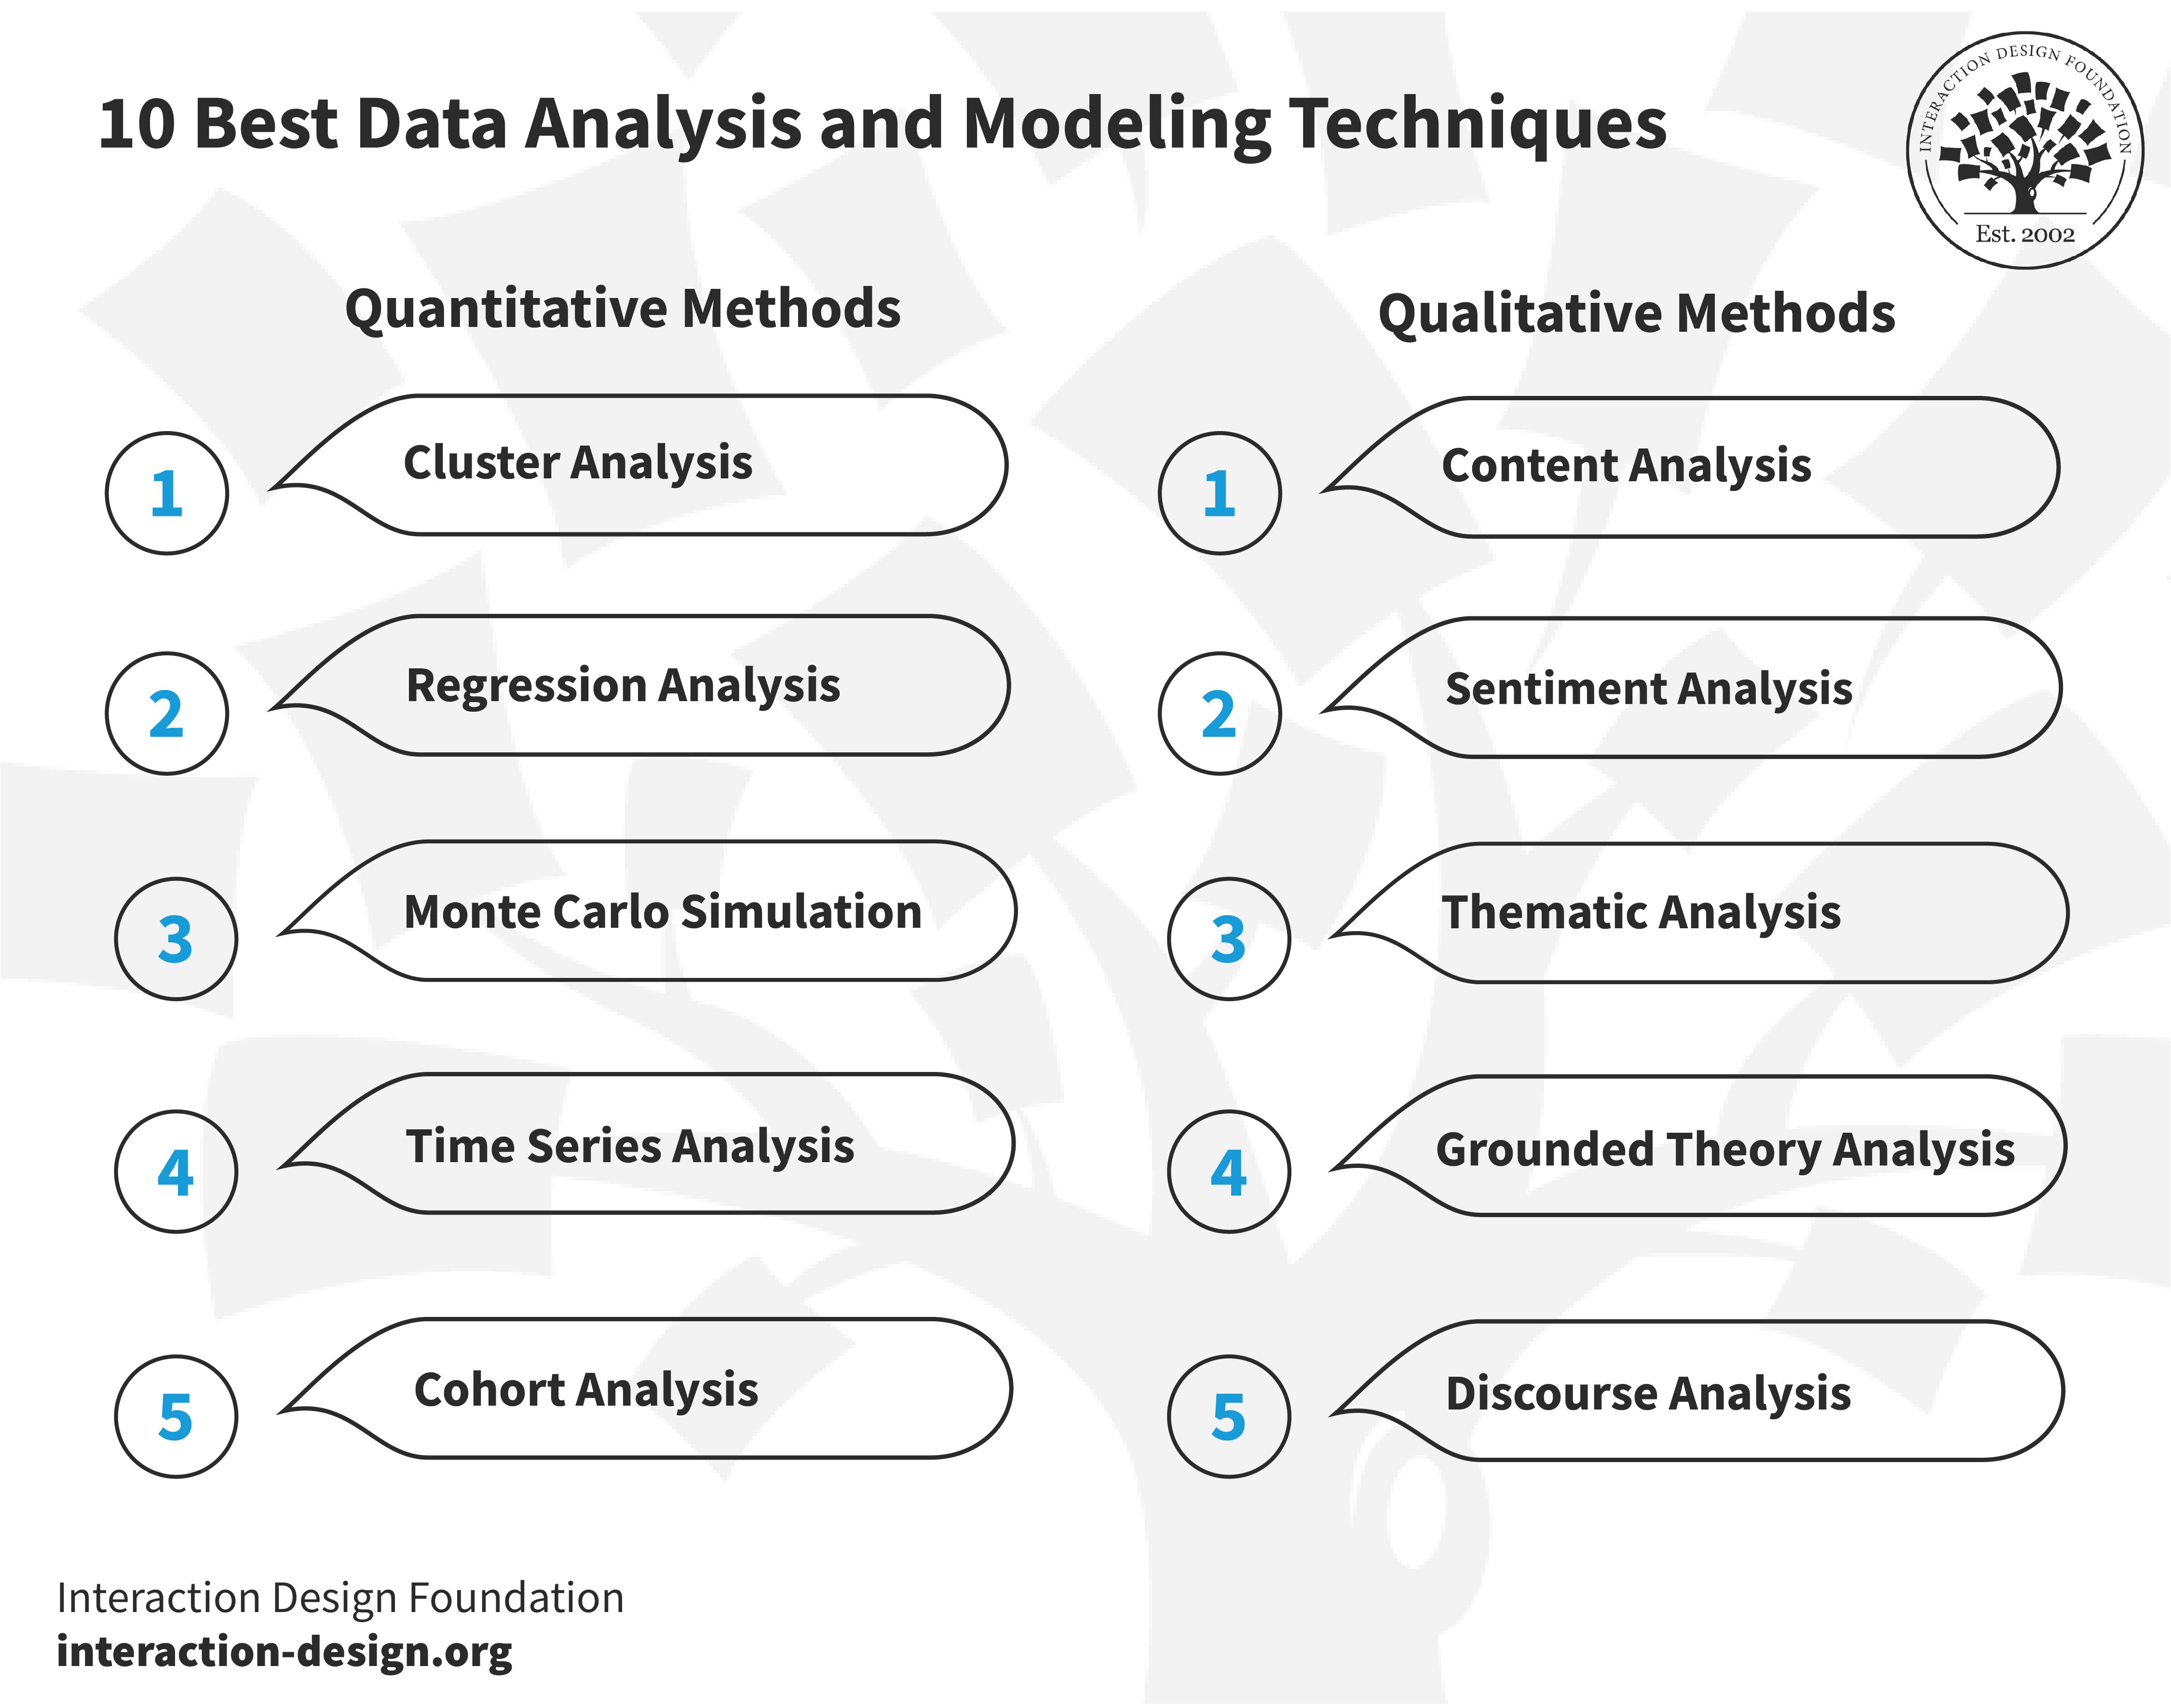
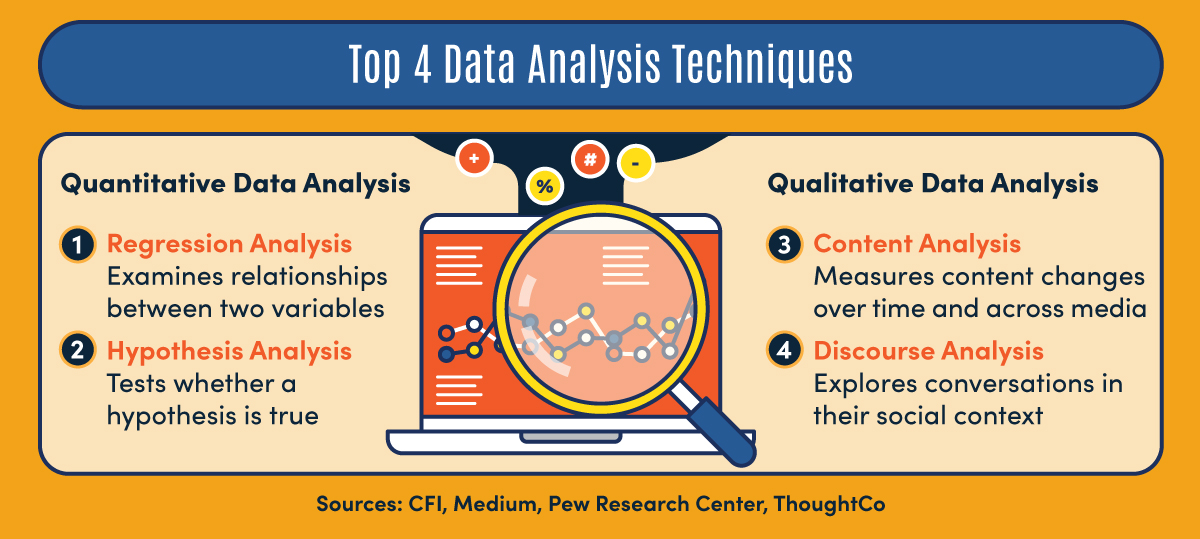
Regression Analysis
Regression analysis is a statistical method used to examine the relationship between a dependent variable and one or more independent variables. It’s used to predict future values based on past data. Regression analysis can be used to model the relationship between variables, allowing you to understand how changes in one variable affect another. There are various types of regression, including linear regression (for simple relationships) and multiple regression (for multiple independent variables). Understanding the assumptions underlying regression models is critical for ensuring the validity of the results. For instance, linear regression assumes a linear relationship between the variables. Furthermore, multicollinearity (high correlation between independent variables) can affect the stability and interpretability of the results.
Clustering and Segmentation
Clustering algorithms group data points into clusters based on their similarity. Clustering is a powerful technique for identifying distinct groups within a dataset. Common clustering algorithms include k-means and hierarchical clustering. These algorithms are used for customer segmentation, identifying similar customer groups for targeted marketing campaigns. Understanding the characteristics of each cluster is essential for tailoring marketing messages and product offerings. The choice of clustering algorithm depends on the nature of the data and the desired outcome. For instance, k-means is suitable for data with spherical clusters, while hierarchical clustering is better for data with more complex clusters.

Time Series Analysis
Time series analysis is specifically designed to examine data collected over time. It’s used to forecast future values based on historical data. Time series analysis is particularly useful for analyzing sales data, stock prices, and weather patterns. Techniques like moving averages and exponential smoothing are commonly used to identify trends and seasonality. Forecasting models can be built to predict future values, allowing businesses to anticipate demand and optimize inventory levels. Properly handling missing data and outliers is crucial for accurate time series forecasting.
Hypothesis Testing
Hypothesis testing is a fundamental statistical method used to determine whether there is enough evidence to reject a claim or hypothesis. It’s used to assess the significance of data and draw conclusions about populations. Common hypothesis tests include t-tests and ANOVA. These tests are used to compare means, determine if differences between groups are statistically significant, and make inferences about populations. Understanding the assumptions underlying hypothesis tests is crucial for ensuring the validity of the results. For example, a t-test requires that the data is normally distributed.
Sentiment Analysis
Sentiment analysis is a technique used to determine the emotional tone or attitude expressed in text. It’s used to analyze customer reviews, social media posts, and other forms of text data. Sentiment analysis can be used to gauge customer satisfaction, identify potential issues, and understand brand perception. Natural Language Processing (NLP) techniques are commonly employed for sentiment analysis. The accuracy of sentiment analysis depends on the quality of the text data and the sophistication of the algorithms used. Different sentiment analysis models can be used, each with its own strengths and weaknesses.
Association Rule Mining
Association rule mining is a technique used to discover relationships between items in a dataset. It’s used to identify patterns and dependencies in data, such as which products are frequently purchased together. Association rule mining is commonly used in market basket analysis to understand customer behavior and optimize product placement. For example, if customers who buy product A also tend to buy product B, then an association rule can be discovered. These rules can be used to create targeted promotions and improve sales. The most common type of association rule is the Markward-Smith rule, which states that "If A buyers buy B, then C buyers also buy A."
Conclusion
Data analysis techniques are not merely tools; they are a strategic framework for understanding and leveraging the vast amounts of data that organizations are collecting. From descriptive statistics to advanced modeling techniques, a diverse toolkit of methods empowers businesses to make data-driven decisions, optimize operations, and gain a competitive advantage. The continuous evolution of data technologies and analytical methods ensures that the importance of data analysis techniques will only continue to grow. Investing in training and development for data analysts and data scientists is crucial for organizations seeking to thrive in the data-driven era. Ultimately, the ability to effectively interpret and apply these techniques will be a defining skill for success in the 21st century. Further exploration into specific applications within your industry will undoubtedly reveal even more nuanced and impactful techniques.