In today’s competitive landscape, businesses are constantly seeking ways to optimize performance, identify trends, and make data-driven decisions. At the heart of this transformation lies the implementation of business analytics dashboards. These aren’t just pretty charts; they’re powerful tools that provide a real-time, consolidated view of key business metrics, enabling organizations to understand their operations, identify areas for improvement, and ultimately, achieve their strategic goals. This article will delve into what business analytics dashboards are, why they’re crucial, and how to effectively implement and utilize them. Understanding the fundamentals of these tools is essential for any business leader looking to gain a competitive edge.

What Are Business Analytics Dashboards?
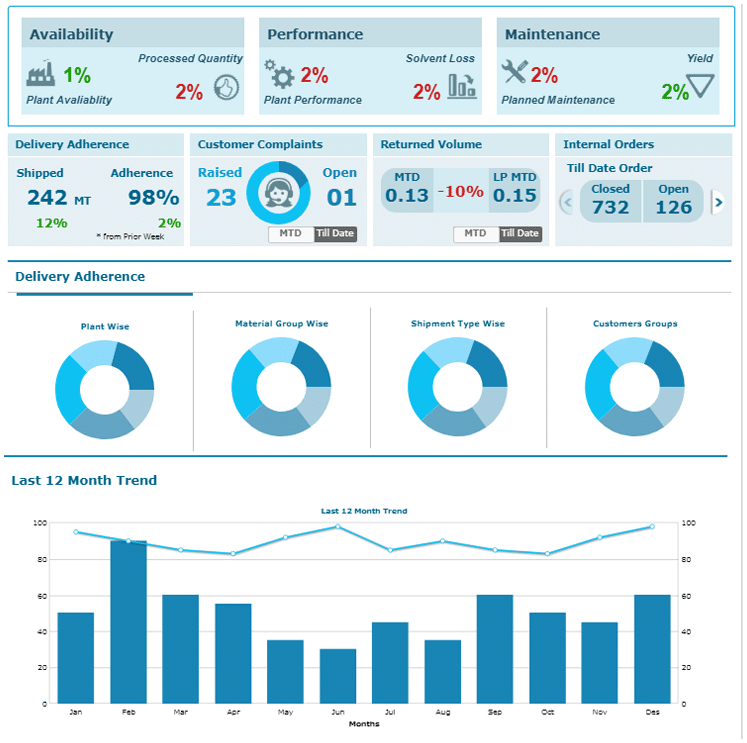
A business analytics dashboard is a visual representation of key performance indicators (KPIs) and other relevant data. Think of it as a central hub for monitoring and understanding your business’s health. Unlike traditional reports that often present data in a static, sequential format, dashboards offer dynamic, interactive views that allow users to explore data, drill down into specific areas, and quickly identify trends. They’re designed to be accessible to a wide range of users, from executives to operational staff, and are typically built using a combination of charts, graphs, tables, and other visual elements. The primary goal is to provide a clear and concise overview of the business’s current state, facilitating informed decision-making. They’re more than just a collection of numbers; they’re a narrative of the business’s performance.
The Benefits of Implementing Business Analytics Dashboards
The adoption of business analytics dashboards offers a multitude of benefits for businesses of all sizes. Firstly, they significantly improve visibility. By presenting data in an easily digestible format, dashboards eliminate the need for employees to sift through multiple reports and spreadsheets. This reduces the risk of overlooking critical information. Secondly, they enhance decision-making. Real-time insights allow for quicker and more accurate responses to changing market conditions or operational challenges. Thirdly, dashboards promote accountability. By tracking KPIs and performance against targets, teams can clearly understand who is responsible for what and identify areas where improvements are needed. Finally, they foster collaboration. Dashboards provide a shared platform for teams to discuss performance, share insights, and work together to achieve common goals. The ability to quickly understand the overall health of the business is a powerful advantage.
Key Components of a Business Analytics Dashboard
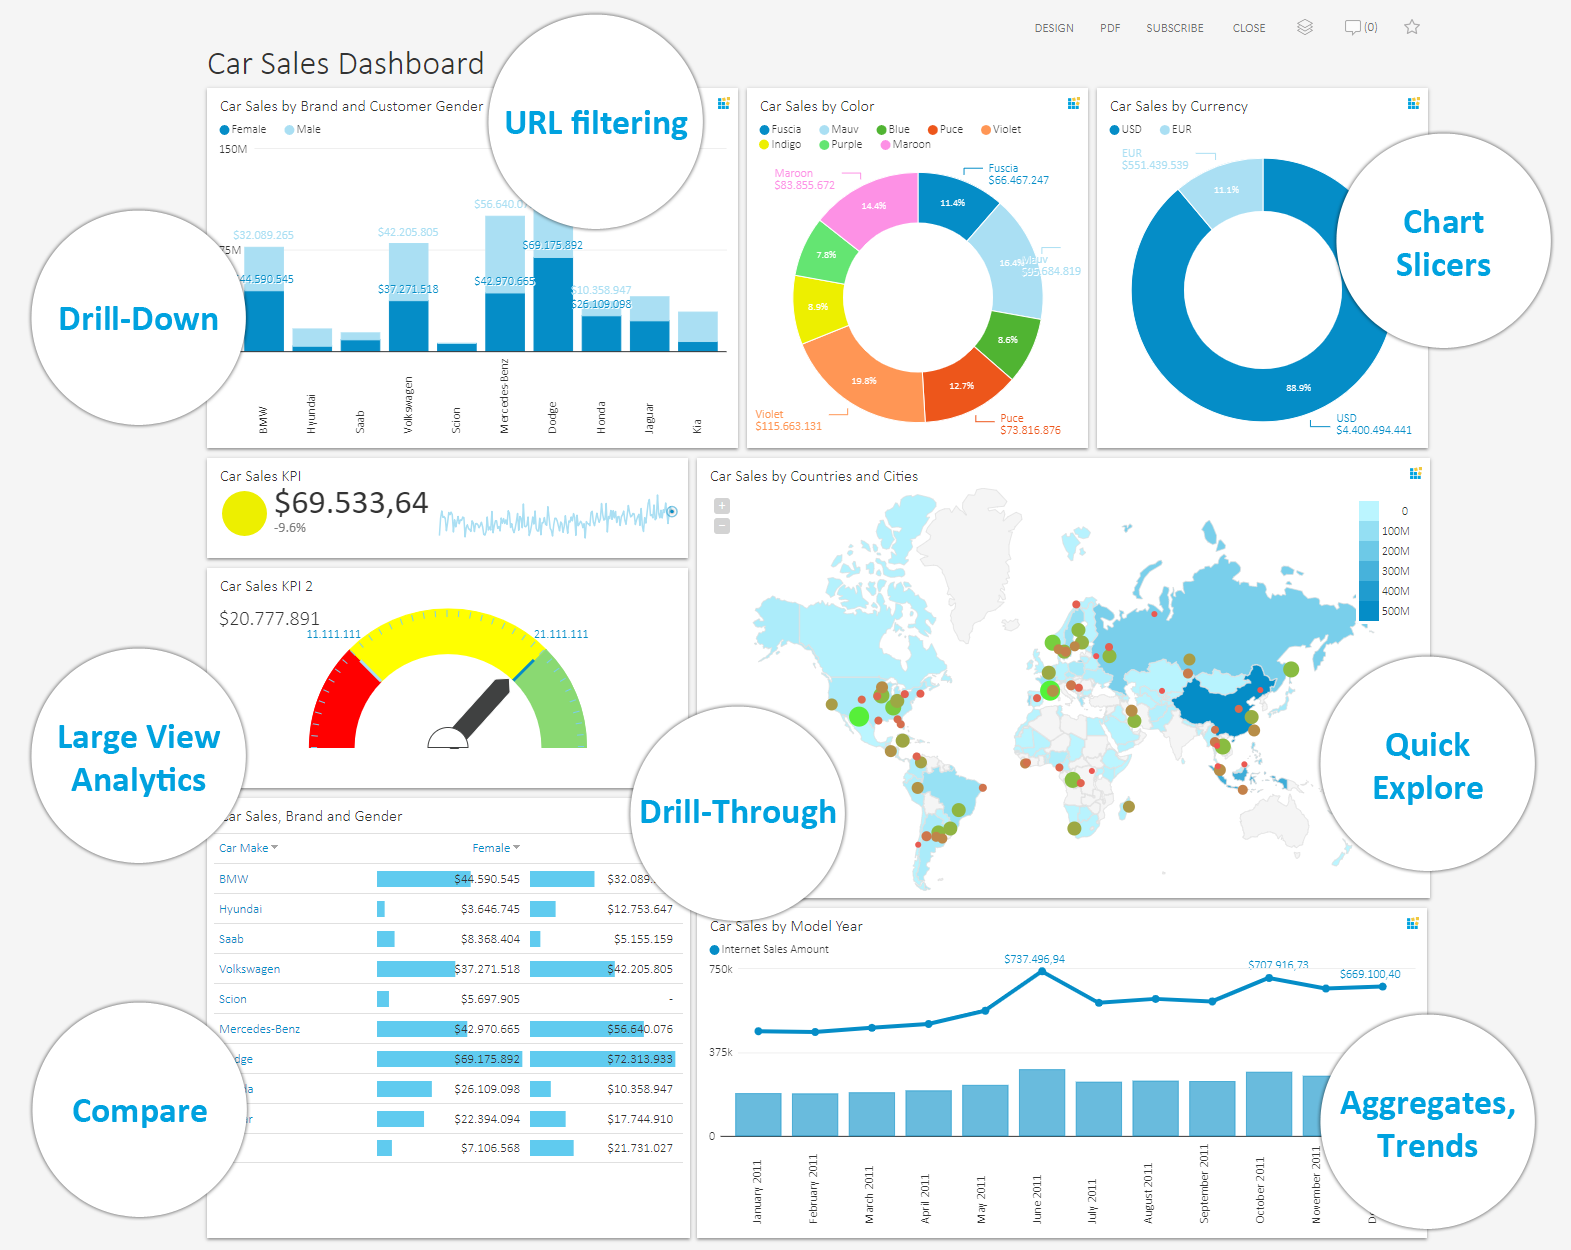
A well-designed business analytics dashboard typically incorporates several key components. KPIs – Key Performance Indicators – are the core of the dashboard, providing a snapshot of the most important metrics. These could include sales revenue, customer acquisition cost, website traffic, or operational efficiency metrics. Charts and graphs are used to visually represent the data, making it easier to understand trends and patterns. Tables provide a more detailed view of the data, allowing users to explore specific values. Filters and drill-down capabilities are crucial for allowing users to focus on the data that is most relevant to their needs. Finally, interactive elements such as tooltips and zooming capabilities enhance the user experience. The specific components and layout will vary depending on the business and the data being presented.

Types of Business Analytics Dashboards
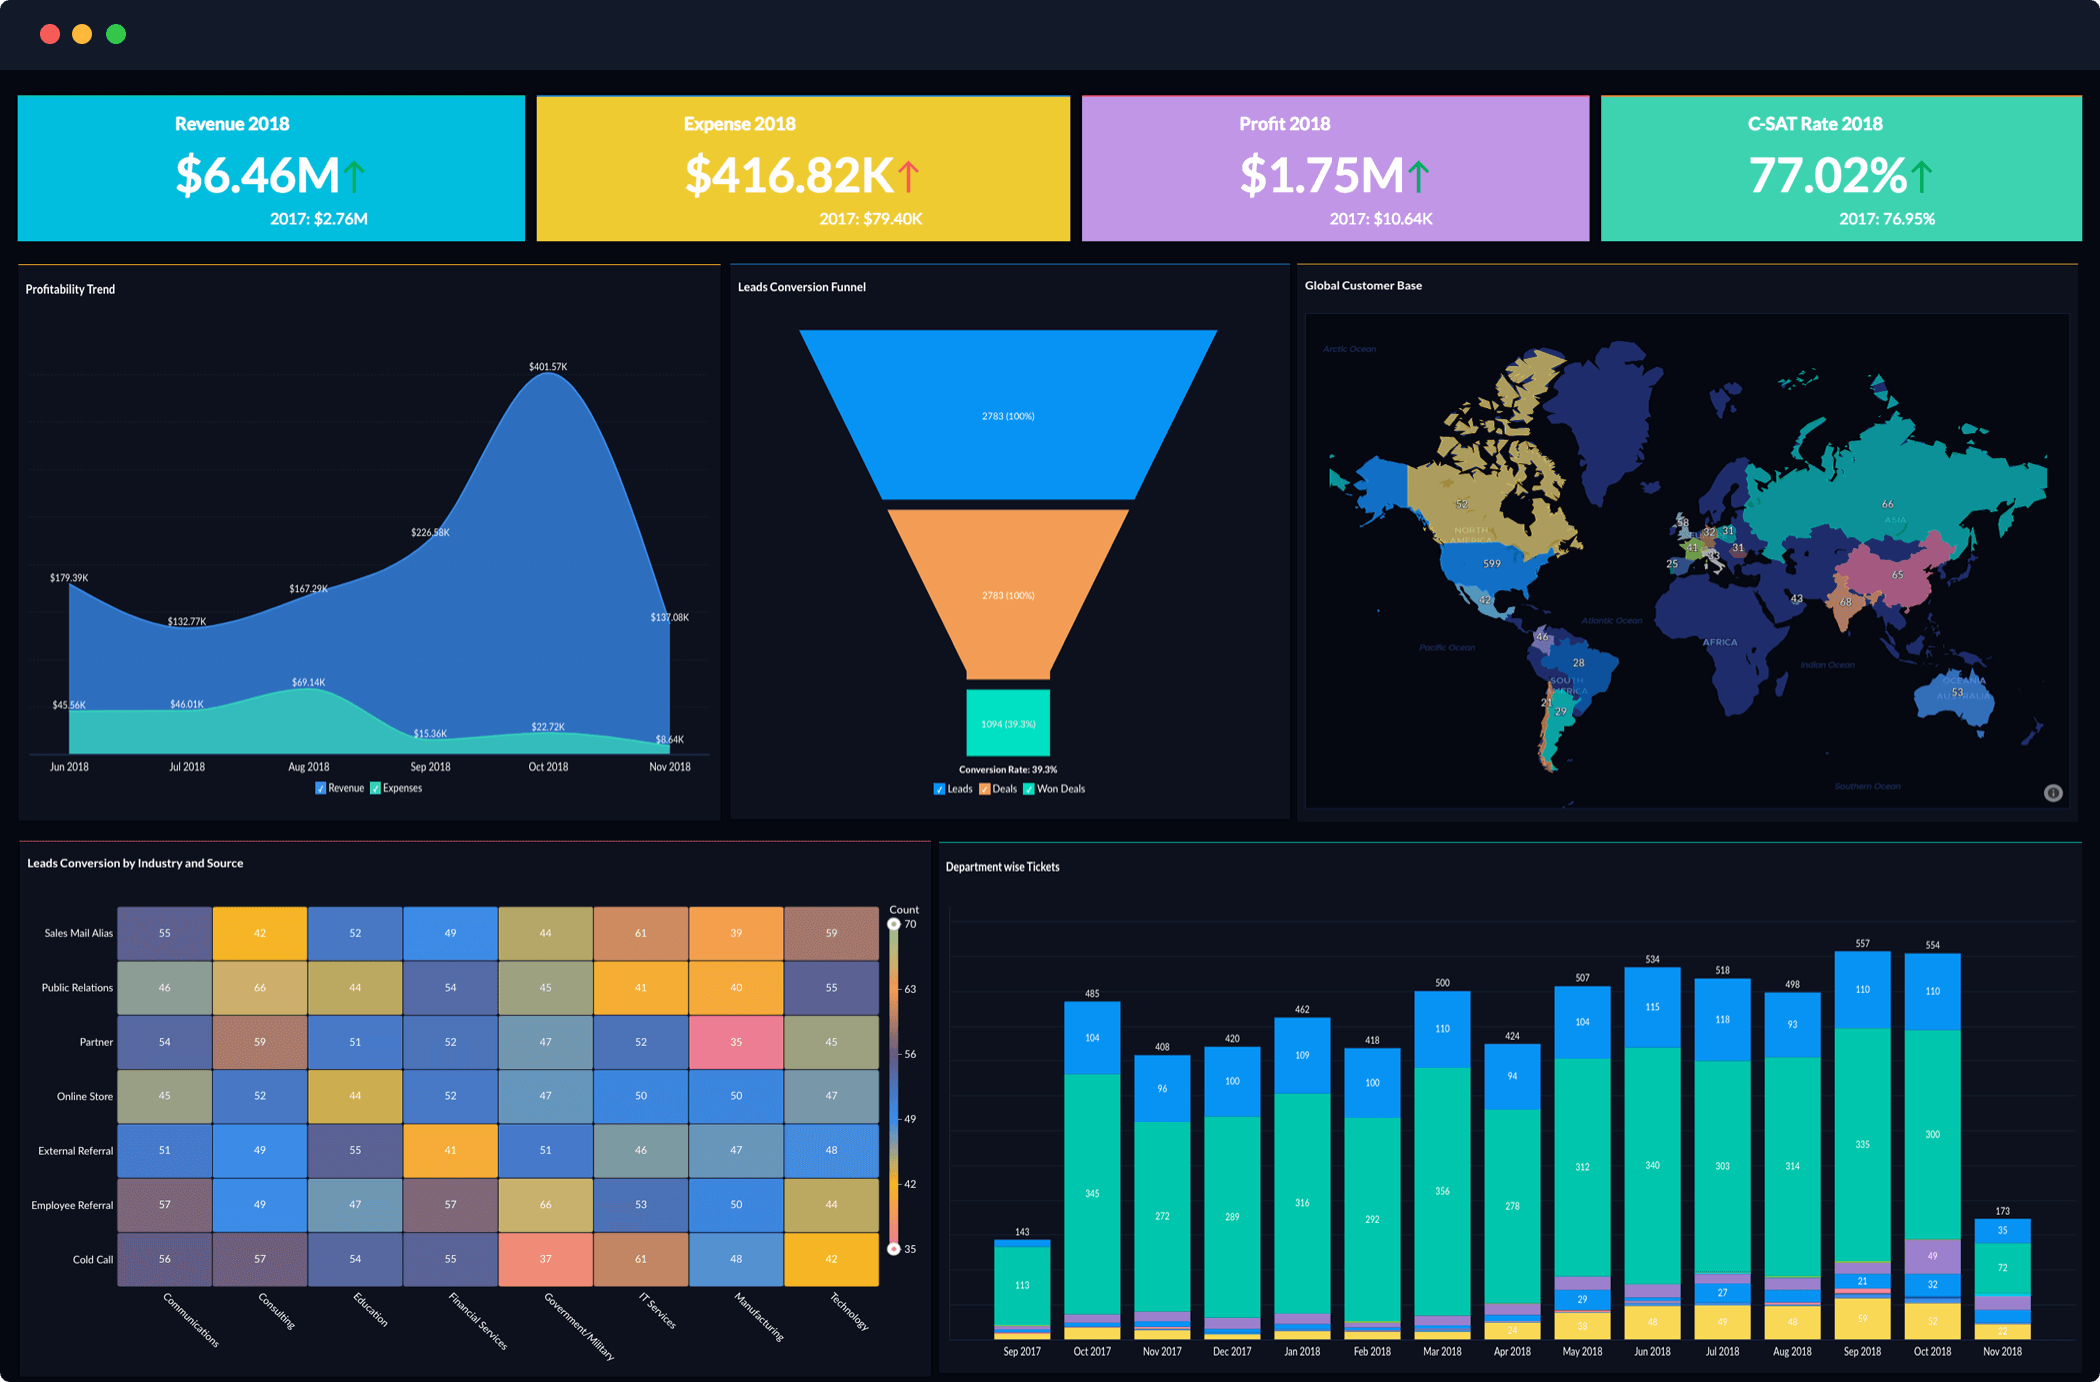
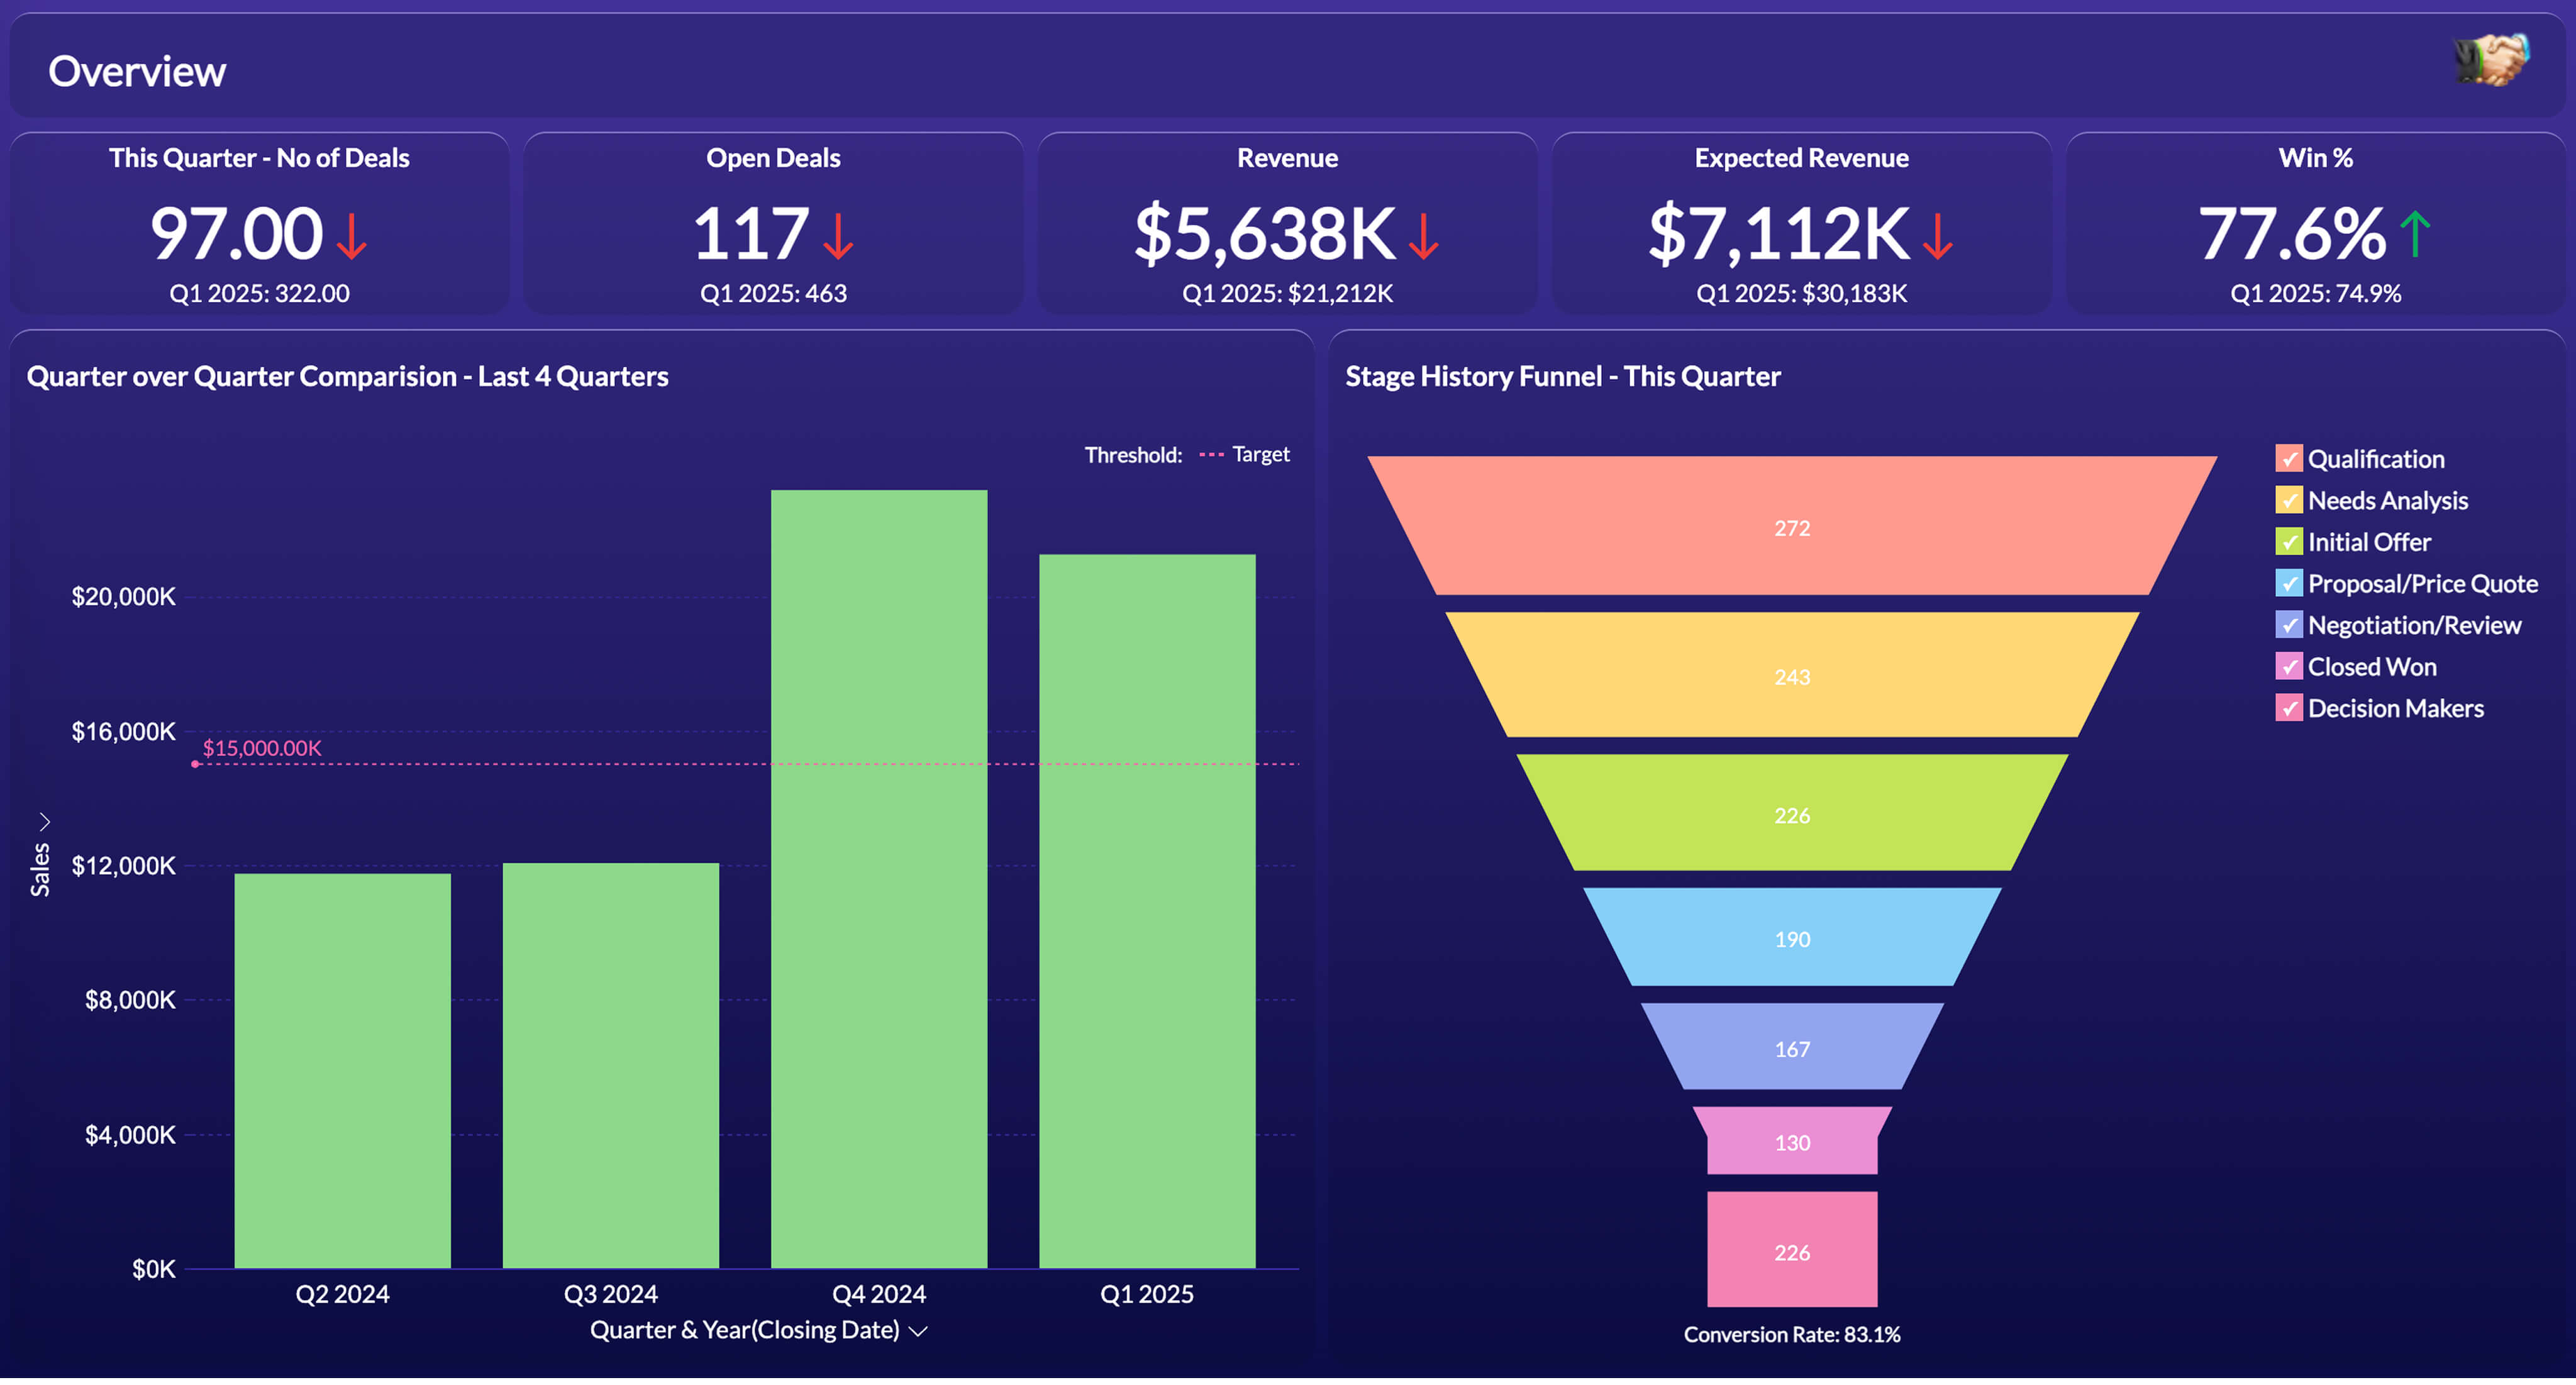
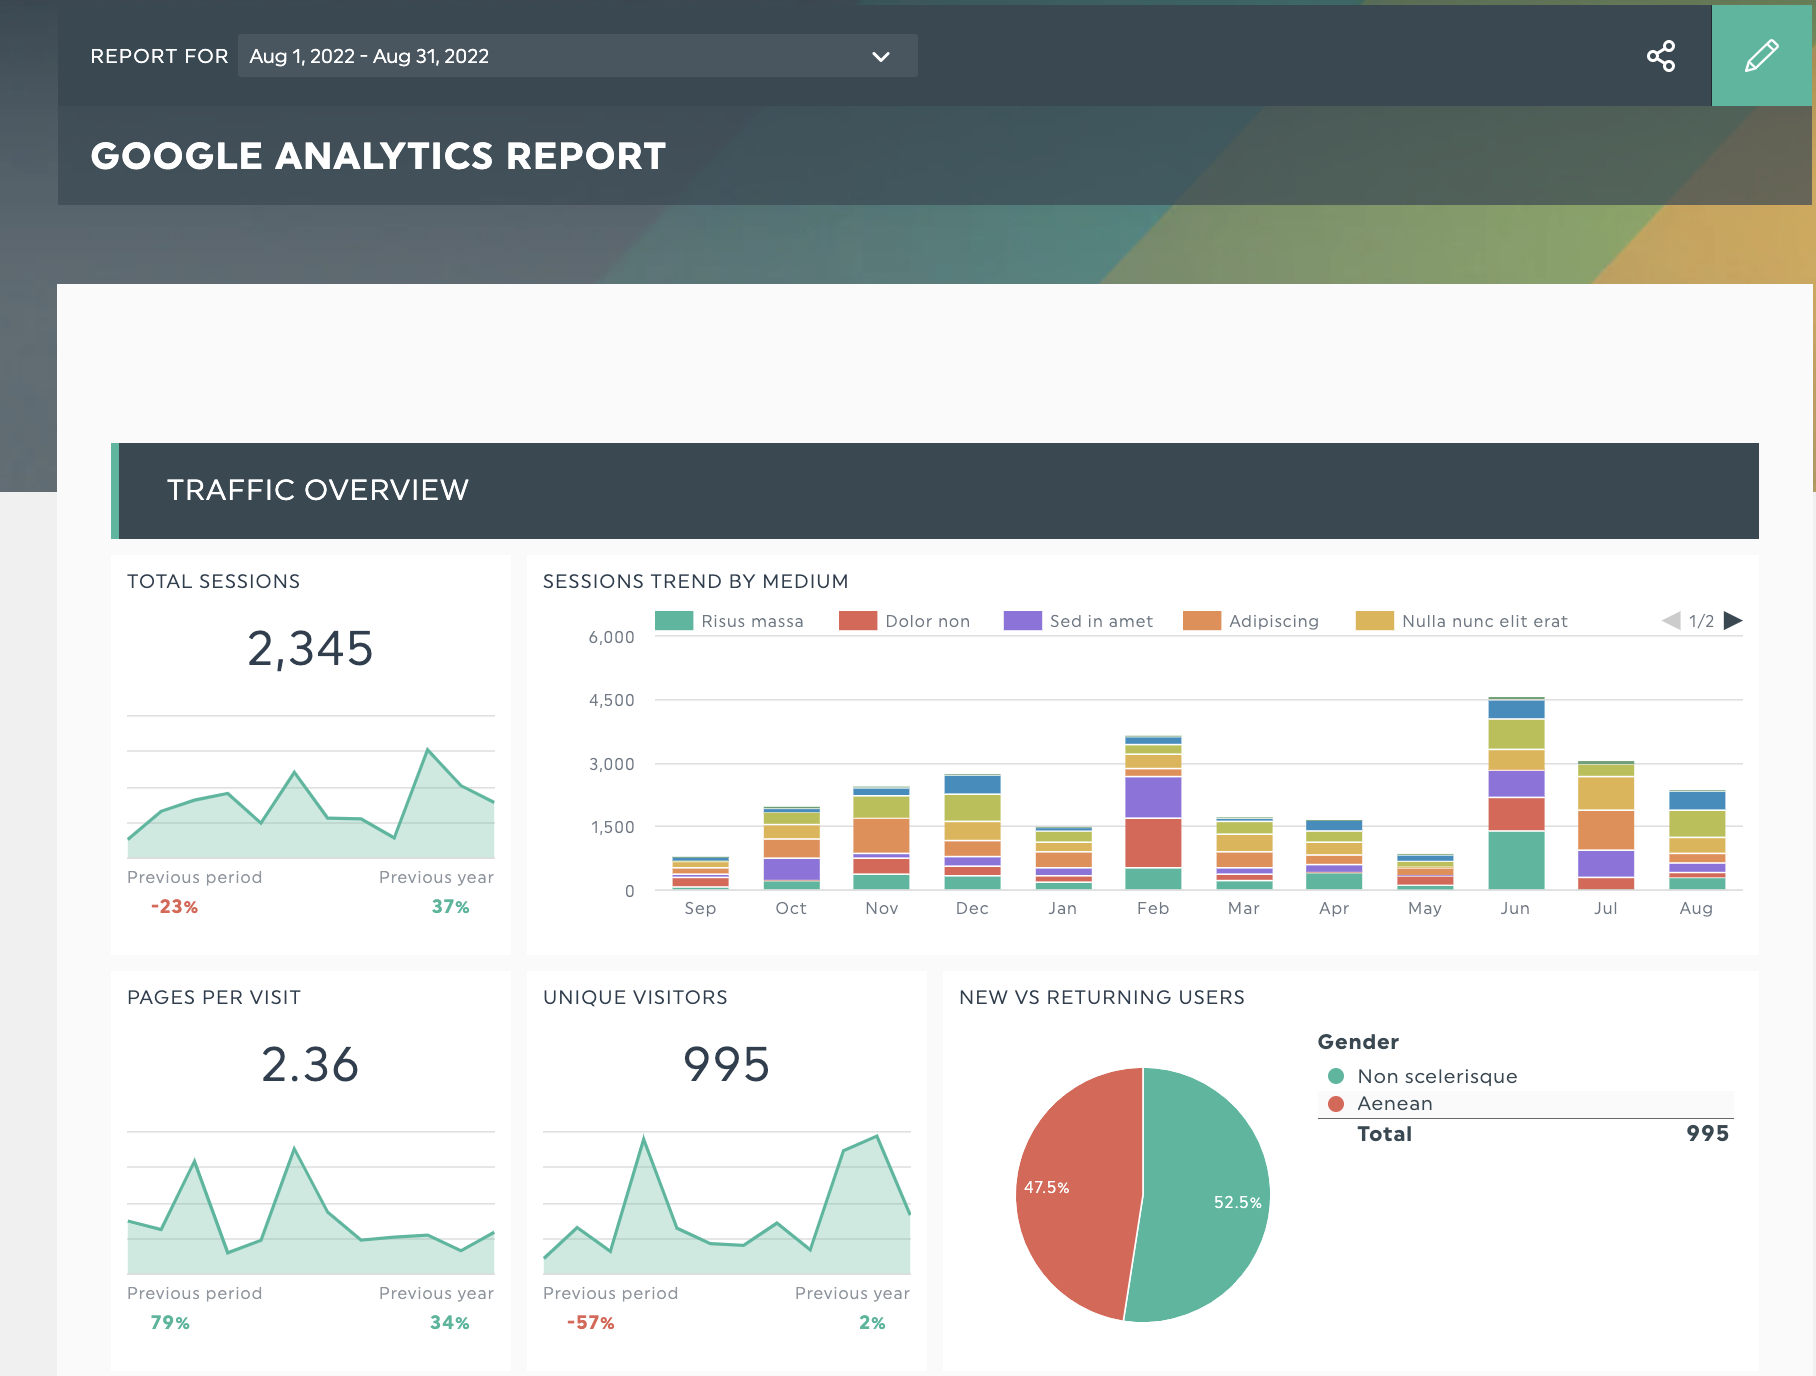
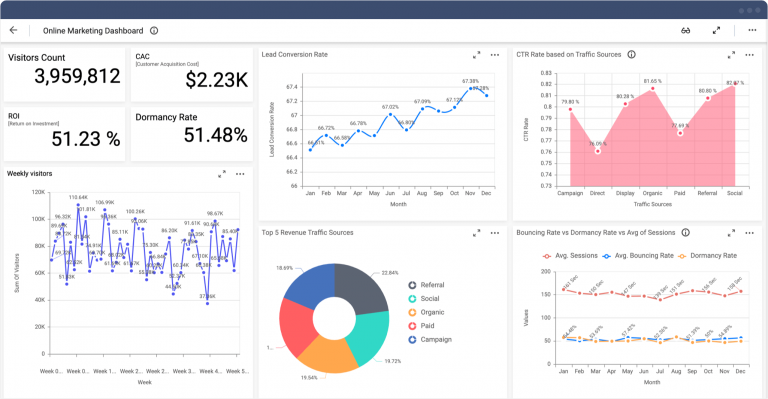
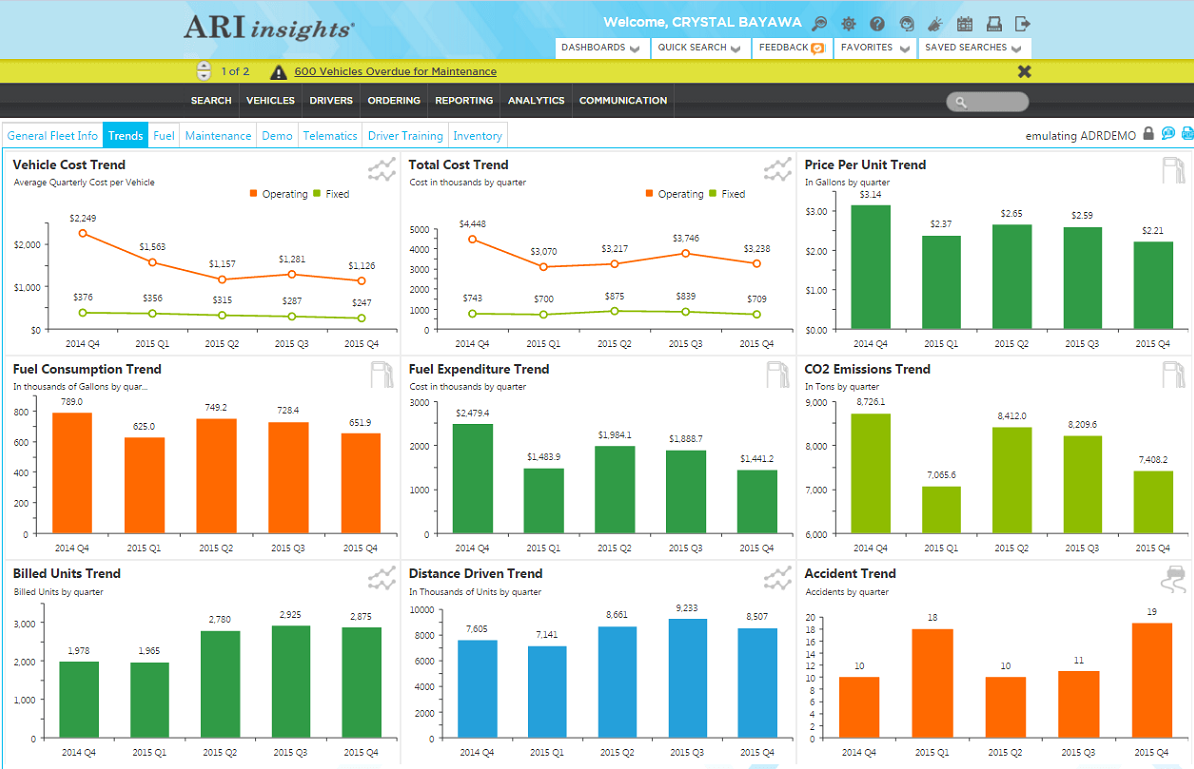
There are several different types of business analytics dashboards, each tailored to specific needs and objectives. Sales dashboards focus on sales performance, tracking revenue, lead generation, and conversion rates. Marketing dashboards analyze marketing campaign effectiveness, website traffic, and social media engagement. Operational dashboards monitor key operational metrics such as production output, inventory levels, and supply chain efficiency. Financial dashboards provide a comprehensive view of the company’s financial performance, including revenue, expenses, and profitability. Customer analytics dashboards focus on understanding customer behavior, identifying churn risks, and improving customer satisfaction. The choice of type depends entirely on the business’s priorities.

Choosing the Right Tools for Your Dashboard
Selecting the right tools for building and deploying business analytics dashboards is a critical decision. Several options are available, ranging from simple spreadsheet-based tools to sophisticated business intelligence platforms. Tableau, Power BI, and Google Data Studio are popular choices, offering a wide range of features and integrations. Python-based libraries like Dash and Streamlit provide more flexibility and customization options, particularly for developers. Consider factors such as ease of use, cost, scalability, and integration with existing systems when making your selection. Don’t underestimate the importance of a clear understanding of your data sources and the technical skills of your team.
Best Practices for Effective Dashboard Design
Creating an effective business analytics dashboard requires more than just collecting data; it demands thoughtful design. Here are some best practices:
- Start with a clear objective: What problem are you trying to solve with the dashboard?
- Focus on the most important KPIs: Don’t overwhelm users with too much data.
- Use clear and concise visuals: Charts and graphs should be easy to understand.
- Keep it simple: Avoid clutter and unnecessary complexity.
- Ensure interactivity: Allow users to explore the data and drill down into specific areas.
- Regularly review and update: Data changes over time, so dashboards need to be updated accordingly.
- Mobile responsiveness: Ensure the dashboard is accessible on a variety of devices.
The Future of Business Analytics Dashboards
The landscape of business analytics dashboards is constantly evolving. Artificial intelligence (AI) and machine learning (ML) are increasingly being integrated into dashboards, enabling automated insights, predictive analytics, and personalized recommendations. Real-time data streaming is becoming more prevalent, allowing for immediate updates and alerts. Data visualization technologies are becoming more sophisticated, offering richer and more interactive visualizations. Cloud-based analytics platforms are simplifying deployment and scalability. We can expect to see even more sophisticated dashboards in the future, driven by advancements in AI and data science. The trend is towards more automated insights and predictive capabilities, empowering businesses to make even more informed decisions.
Conclusion
Business analytics dashboards are no longer a luxury; they are a necessity for businesses of all sizes. They provide a powerful way to gain visibility into key business metrics, improve decision-making, and drive organizational performance. By understanding the benefits, components, and best practices for creating effective dashboards, businesses can unlock the full potential of their data and achieve their strategic goals. Investing in a robust dashboard strategy is an investment in the future success of the organization. The core concept – understanding and communicating data effectively – remains the most valuable asset in today’s data-driven world. Ultimately, a well-designed dashboard transforms raw data into actionable intelligence.