Data analysis is no longer a niche skill; it’s a fundamental requirement for informed decision-making across virtually every industry. From marketing and finance to healthcare and supply chain management, organizations are drowning in data, but often struggle to extract meaningful insights. Effective data analysis isn’t just about crunching numbers; it’s about transforming raw information into actionable intelligence. This article will provide a comprehensive overview of data analysis strategies, covering key techniques, tools, and best practices to help you unlock the power of your data. Data analysis is the process of examining raw data to draw conclusions about that data. It’s a continuous cycle of collecting, cleaning, exploring, and interpreting data to identify trends, patterns, and insights that can drive business success. Understanding the fundamentals of data analysis is crucial for anyone looking to improve their organization’s performance.
Understanding the Core Principles of Data Analysis
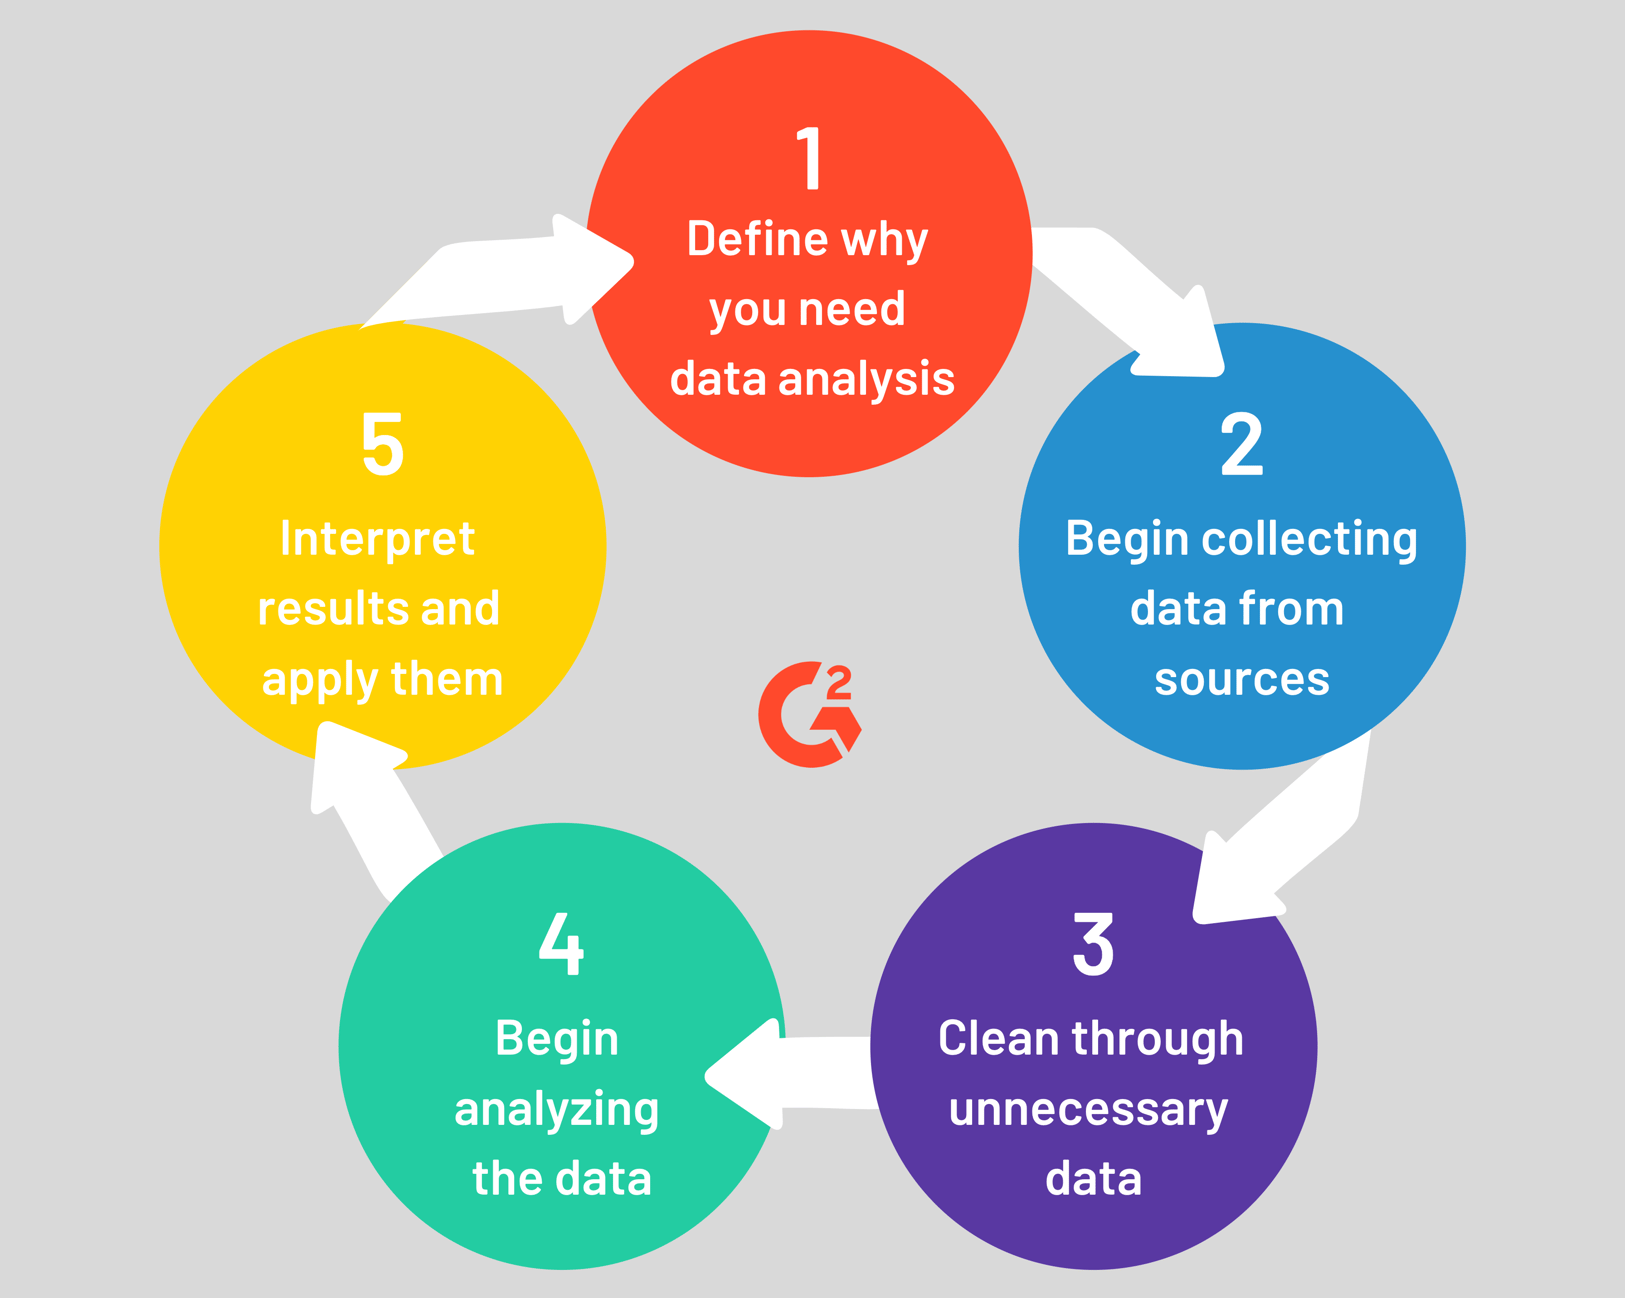
Before diving into specific techniques, it’s important to grasp the underlying principles that drive effective data analysis. The process typically involves several key stages:

- Data Collection: This is the starting point – gathering data from various sources. The quality of your data directly impacts the quality of your analysis. Consider diverse data sources like databases, spreadsheets, APIs, web scraping, and even sensor data.
- Data Cleaning: Raw data is rarely perfect. It often contains errors, inconsistencies, and missing values. Data cleaning involves identifying and correcting these issues – handling missing data, removing duplicates, correcting errors, and standardizing formats. This is often the most time-consuming but crucial step.
- Data Exploration (Exploratory Data Analysis - EDA): This stage involves examining the data to understand its characteristics. EDA techniques include calculating summary statistics (mean, median, standard deviation), creating visualizations (histograms, scatter plots, box plots), and identifying potential relationships between variables. EDA helps uncover patterns and anomalies.
- Data Modeling: Once you have a good understanding of your data, you can build models to predict future outcomes or segment your audience. Common modeling techniques include regression, classification, and clustering.
- Interpretation & Reporting: The final step involves translating your findings into actionable insights and communicating them effectively to stakeholders. This requires clear and concise reporting, often using visualizations and storytelling.
Techniques for Effective Data Analysis
Let’s explore several key techniques that can be employed in data analysis:

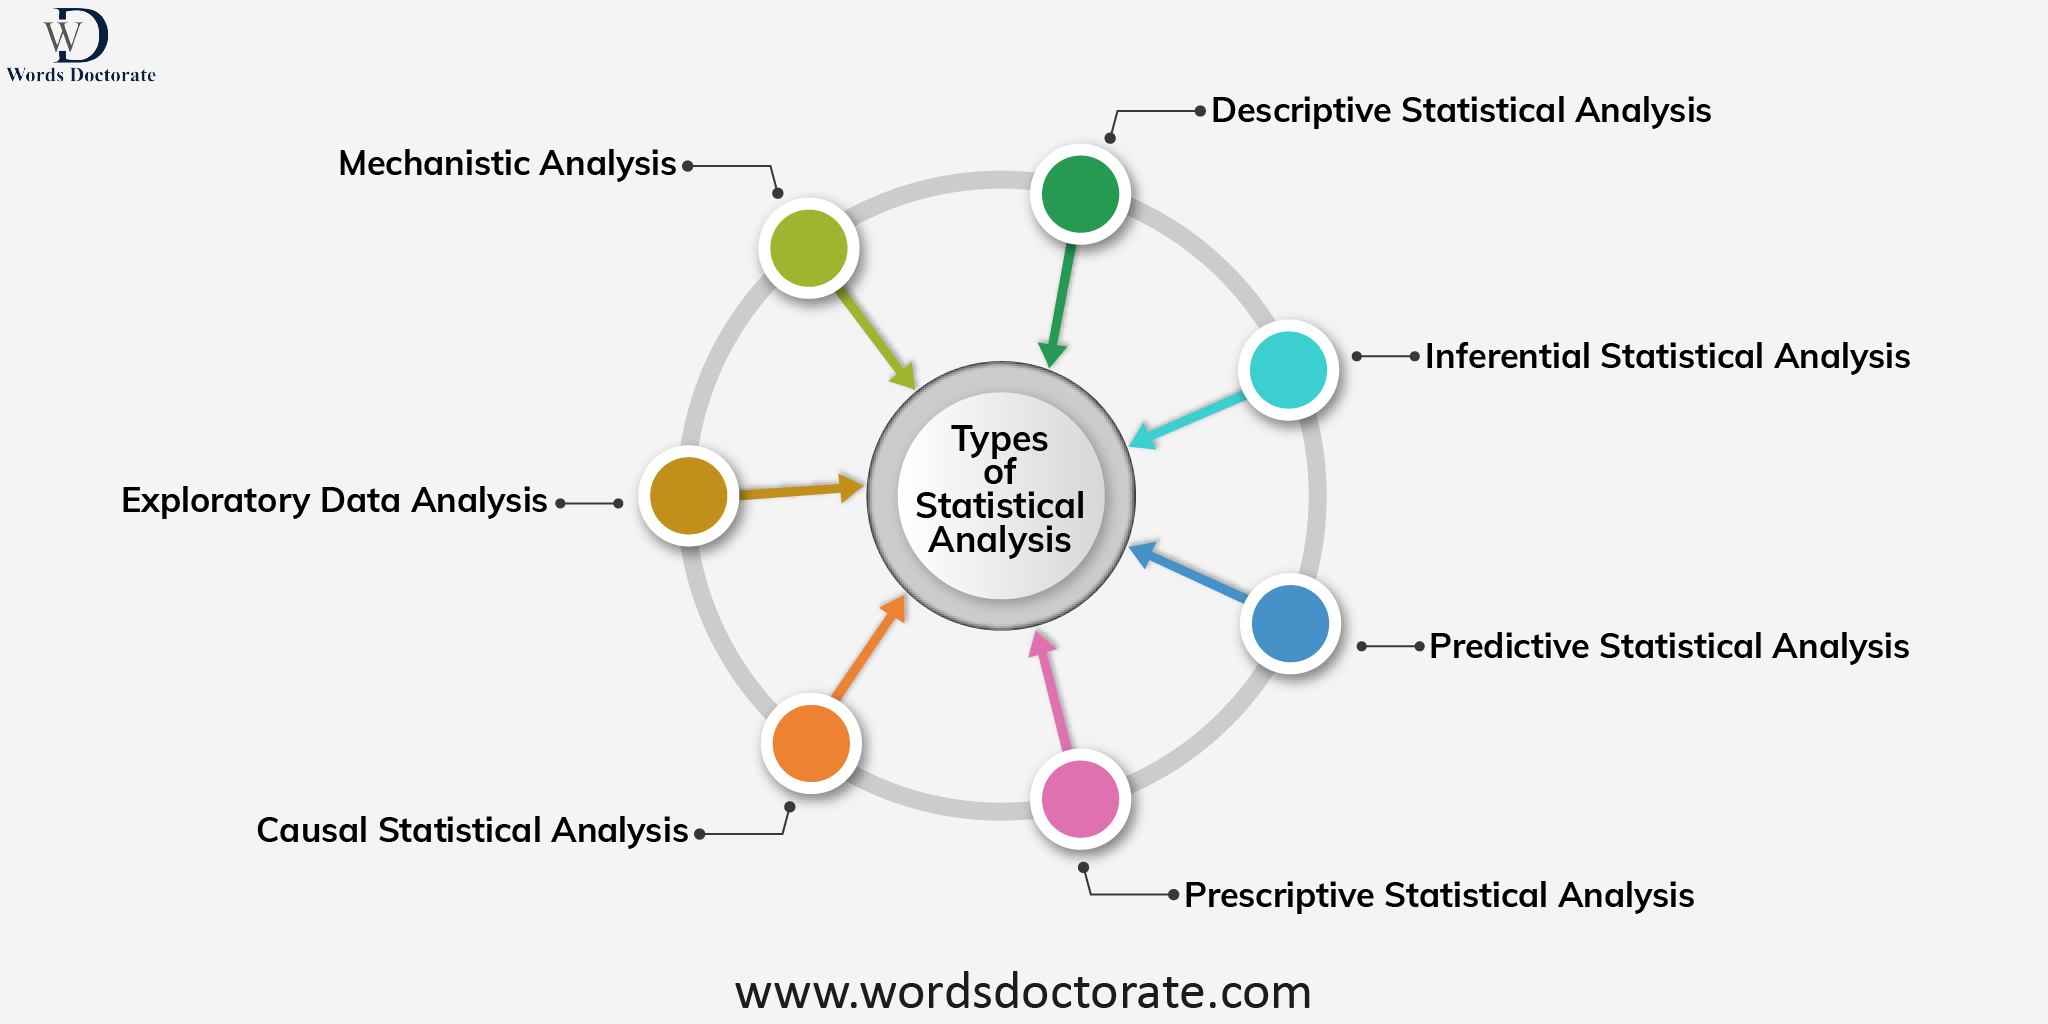
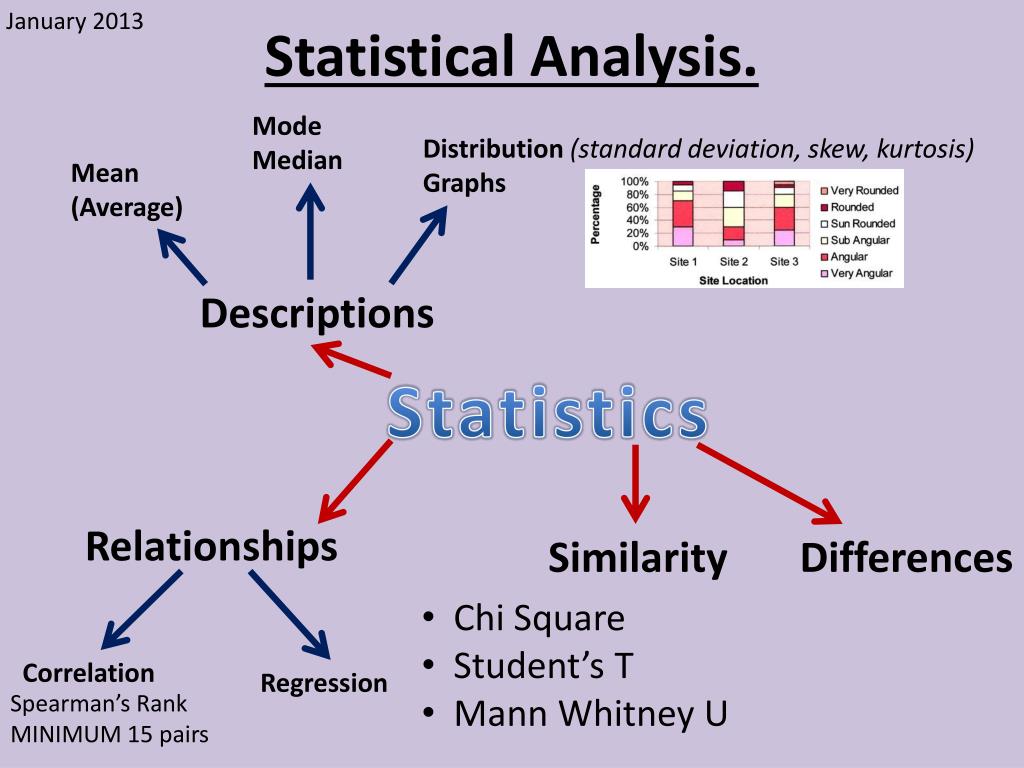
1. Descriptive Analysis
Descriptive analysis focuses on summarizing and describing the characteristics of a dataset. It’s the foundation of many data analysis projects. Techniques include:
- Summary Statistics: Calculating measures like mean, median, mode, standard deviation, and variance to understand the central tendency and spread of your data. Understanding these statistics is vital for identifying outliers and potential problems.
- Data Visualization: Creating charts and graphs (bar charts, pie charts, line graphs, scatter plots) to visually represent data and reveal patterns. Choosing the right visualization type is crucial for conveying the information effectively.
- Frequency Distributions: Determining the frequency of each value in a dataset. This helps understand the distribution of your data and identify potential imbalances.
2. Diagnostic Analysis
Diagnostic analysis aims to understand why something happened. It involves investigating the root causes of problems or trends.
![]()
- Correlation Analysis: Examining the relationship between two or more variables. A strong correlation indicates a potential link, but correlation does not equal causation.
- Drill-Down Analysis: Digging deeper into data to identify the underlying factors driving a particular outcome. For example, if sales are declining in a specific region, drill down to examine factors like competitor activity, pricing, or marketing campaigns.
- Data Mining: Using algorithms to automatically discover patterns and relationships in large datasets. This is particularly useful for identifying anomalies or unexpected trends.
3. Predictive Analysis
Predictive analysis uses statistical models to forecast future outcomes.
- Regression Analysis: Predicting a continuous variable based on one or more predictor variables. Linear regression is a common technique for predicting continuous values.
- Classification: Predicting a categorical variable (e.g., spam/not spam) based on input data. Algorithms like decision trees and support vector machines are commonly used.
- Time Series Analysis: Analyzing data collected over time to identify trends, seasonality, and other patterns. This is crucial for forecasting future demand or predicting equipment failures.
Tools for Data Analysis
A variety of tools are available to support data analysis, ranging from free and open-source options to commercial software.
- Spreadsheet Software (Excel, Google Sheets): Excellent for basic data cleaning, analysis, and visualization. They are widely accessible and offer a range of built-in functions.
- Statistical Software (R, Python with Pandas/NumPy): Powerful tools for advanced statistical analysis, data manipulation, and machine learning. R is particularly popular in academia and research. Python is increasingly used in industry for its versatility and extensive libraries.
- Business Intelligence (BI) Tools (Tableau, Power BI): Designed for data visualization and dashboard creation. They allow users to easily explore data and share insights with others.
- SQL (Structured Query Language): Essential for querying and manipulating data stored in relational databases.
Best Practices for Data Analysis
Several best practices can significantly improve the quality and effectiveness of your data analysis efforts:
- Define Clear Objectives: Before you start, clearly define what you want to achieve with your analysis. What questions are you trying to answer?
- Data Quality is Paramount: Invest time in cleaning and validating your data. Garbage in, garbage out.
- Choose the Right Techniques: Select the appropriate techniques based on your objectives and the type of data you have.
- Visualize Your Data: Visualizations are crucial for communicating insights effectively.
- Document Your Process: Keep track of your data analysis steps, including the techniques you used, the results you obtained, and any assumptions you made.
- Iterate and Refine: Data analysis is an iterative process. Don't be afraid to revisit your analysis and refine your approach as you learn more.
Interpreting Results and Communicating Insights
The final step in the data analysis process is to interpret the results and communicate them effectively. This involves:
- Identifying Key Findings: Highlight the most important insights from your analysis.
- Drawing Conclusions: Based on your findings, draw conclusions about the underlying causes of the observed trends.
- Creating Visualizations: Use charts and graphs to illustrate your findings.
- Tailoring Your Message: Adapt your communication to your audience. Avoid technical jargon and focus on the business implications of your findings.
Conclusion
Data analysis is a powerful tool for organizations seeking to gain a competitive advantage. By understanding the core principles, employing appropriate techniques, utilizing the right tools, and adhering to best practices, you can unlock the full potential of your data and drive informed decision-making. Data analysis is not just about numbers; it’s about understanding the stories hidden within them. As data continues to grow in volume and complexity, the ability to effectively analyze and interpret it will become increasingly critical for success. Ultimately, successful data analysis leads to better business outcomes, improved customer experiences, and a stronger competitive position. Remember to consistently apply these strategies to continuously improve your data-driven capabilities.