Data analysis tools have become indispensable in today’s business landscape. From marketing and sales to operations and research, organizations are increasingly relying on data to make informed decisions. Choosing the right tools can be overwhelming, with a plethora of options available. This guide aims to provide a comprehensive overview of the most popular data analysis tools, helping you understand their capabilities and select the best fit for your specific needs. Data analysis tools are no longer a luxury; they are a necessity for driving efficiency, gaining a competitive edge, and unlocking valuable insights. Understanding the different types of tools and their strengths is crucial for maximizing their potential. Let’s dive in!
What is Data Analysis?
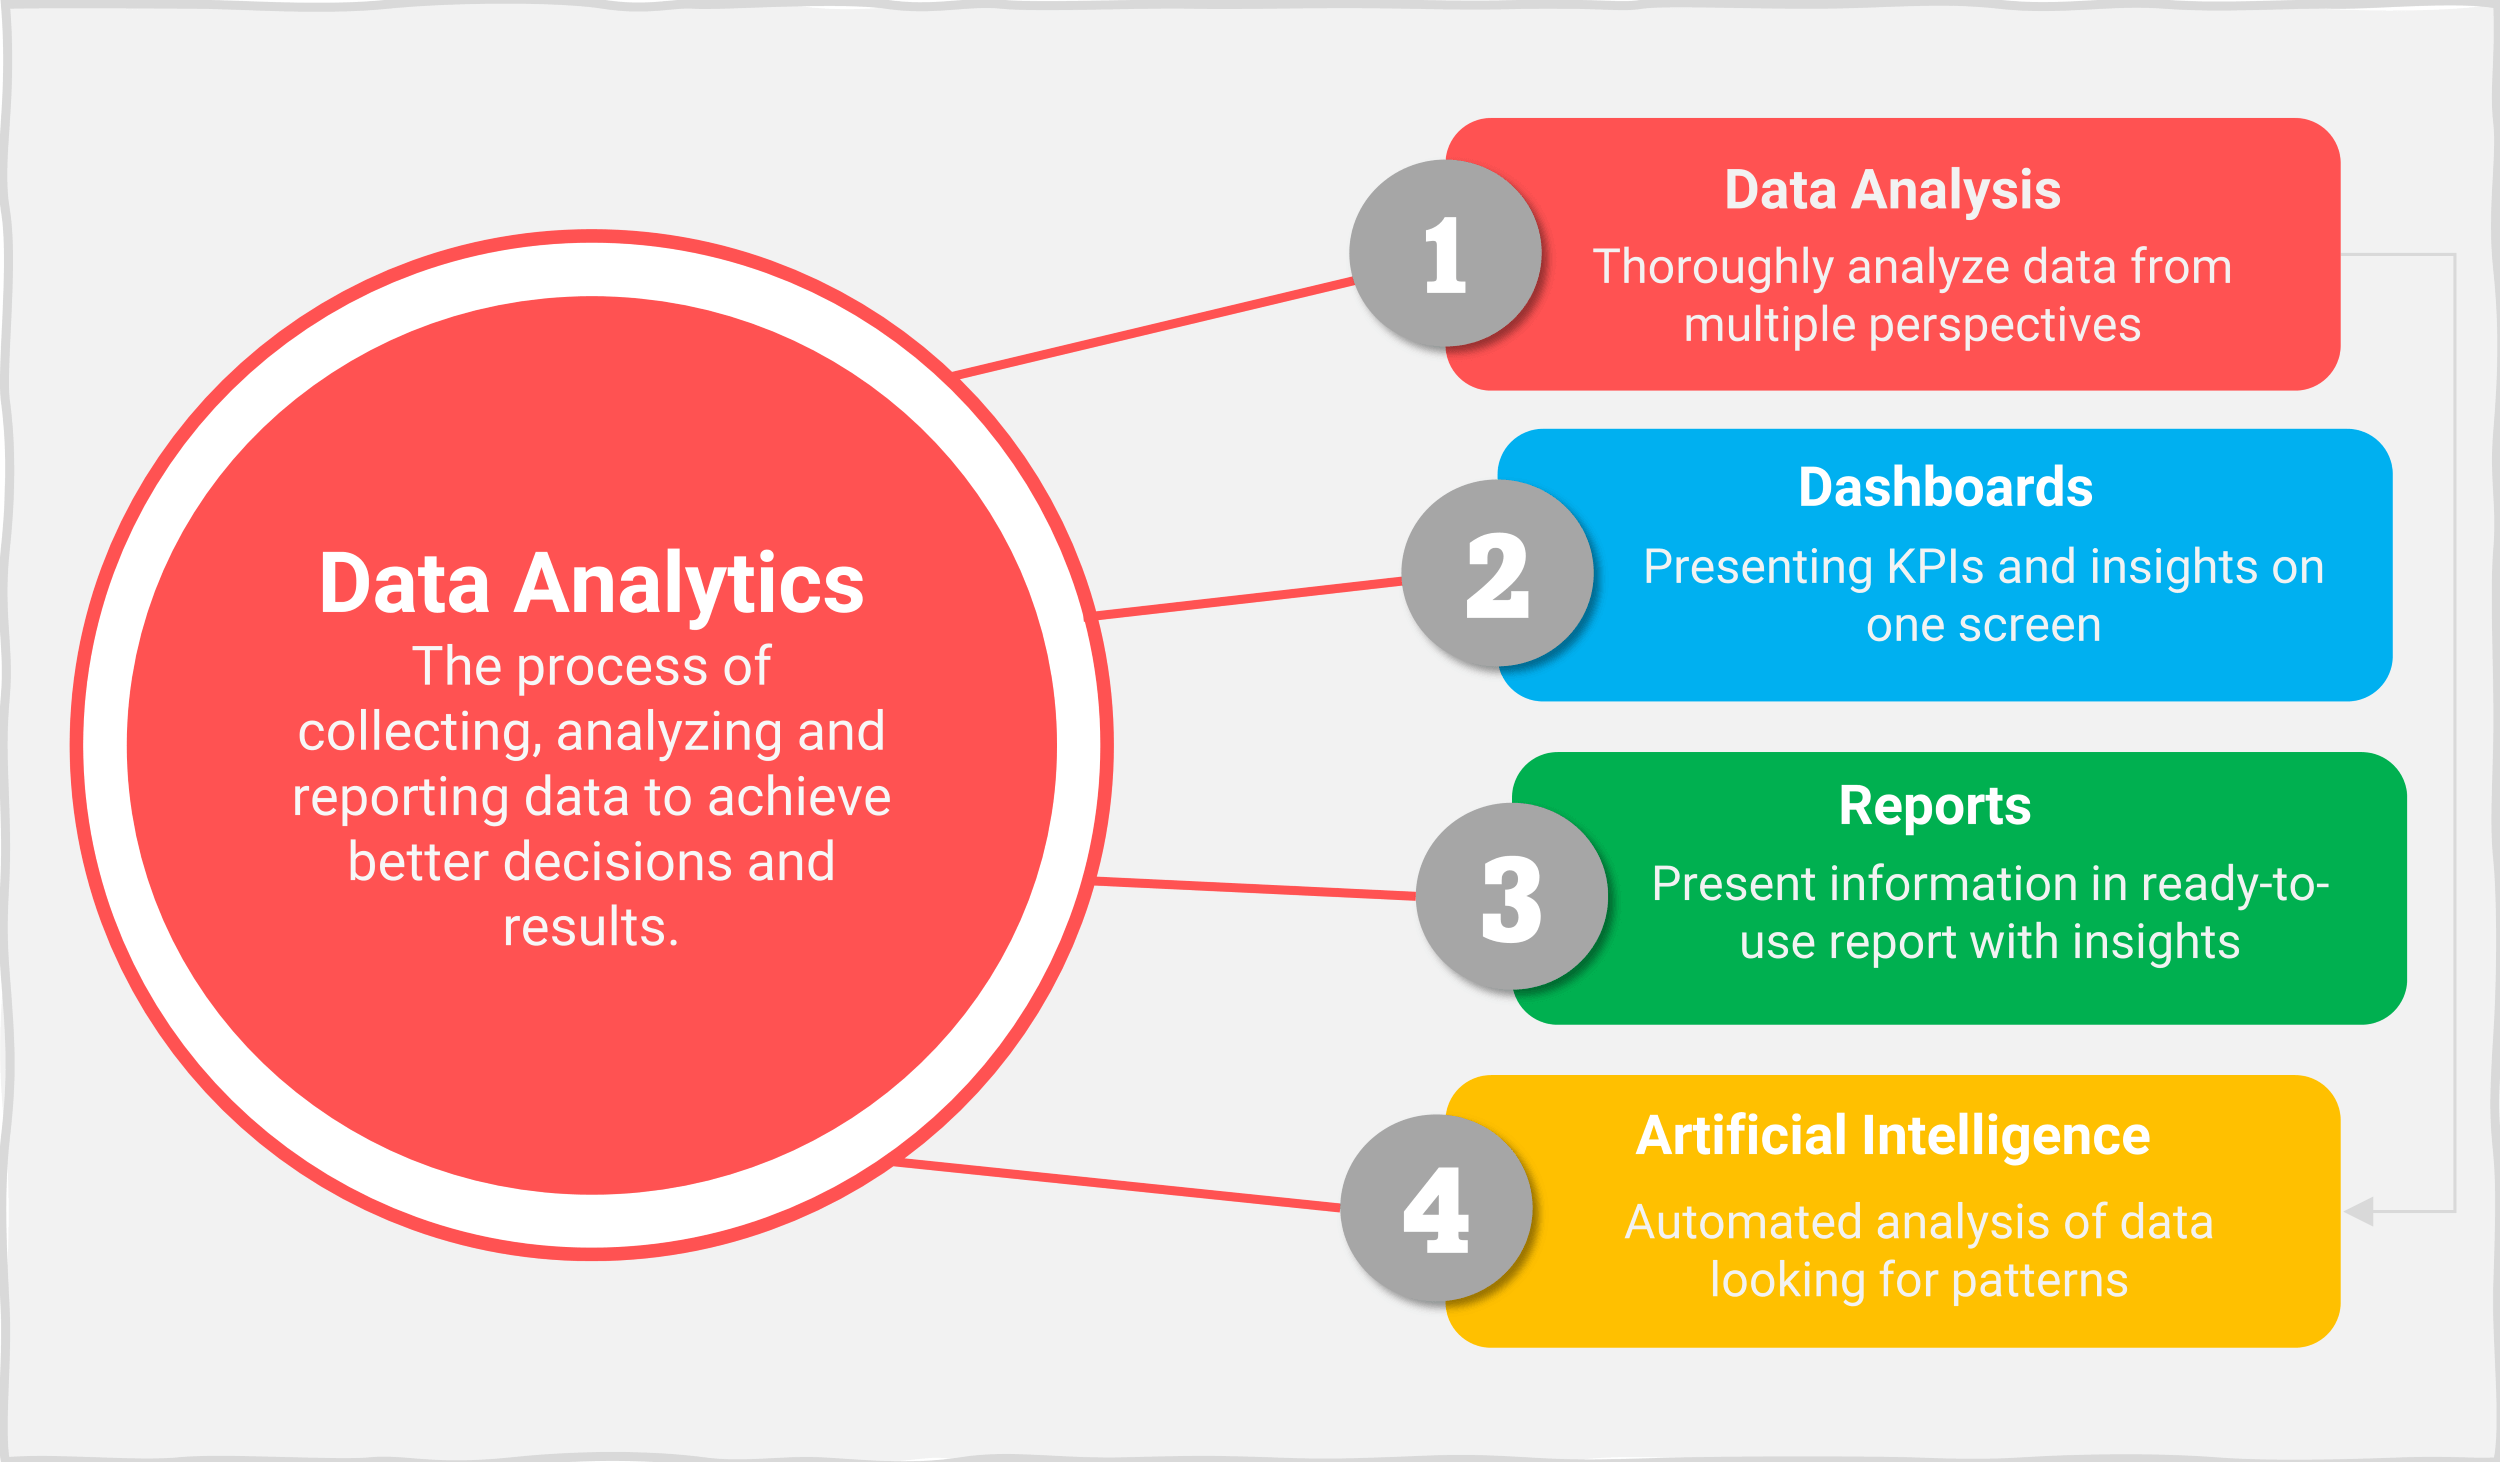
Before we explore the tools, it’s important to understand what data analysis is. It’s the process of examining raw data to discover patterns, trends, and insights. This involves cleaning, transforming, and interpreting data to reveal meaningful information. The goal isn’t just to present numbers; it’s to understand why those numbers are what they are and how they relate to business objectives. Effective data analysis often involves statistical techniques, visualization, and the application of domain expertise. Without proper data analysis, businesses risk making decisions based on incomplete or misleading information. The process can range from simple spreadsheets to complex machine learning models, depending on the complexity of the data and the desired outcome.
![]()
Popular Data Analysis Tools
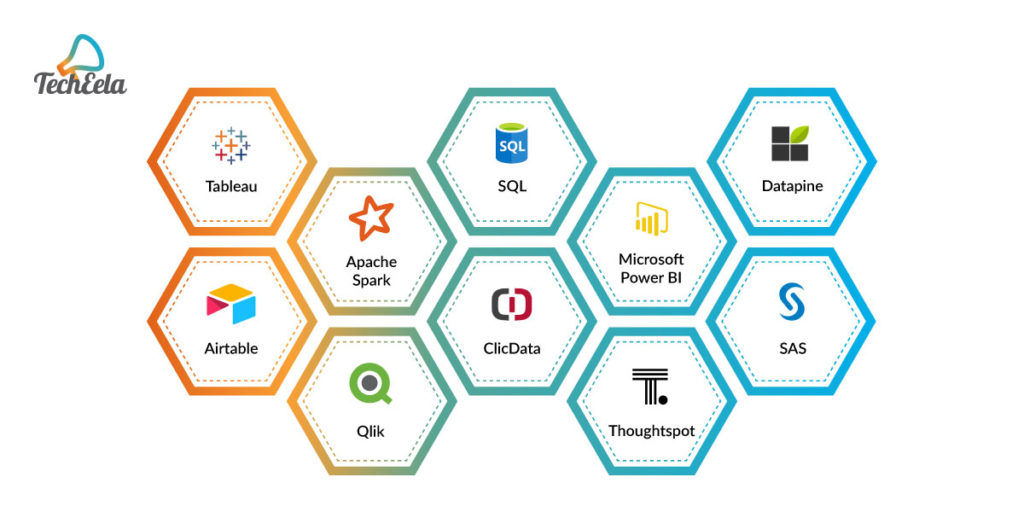
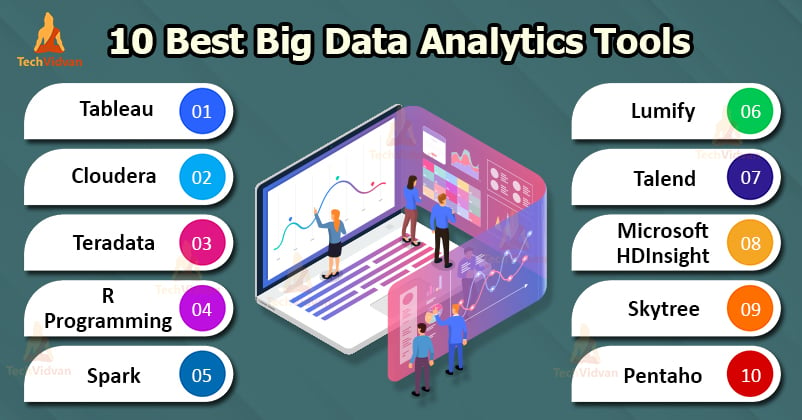
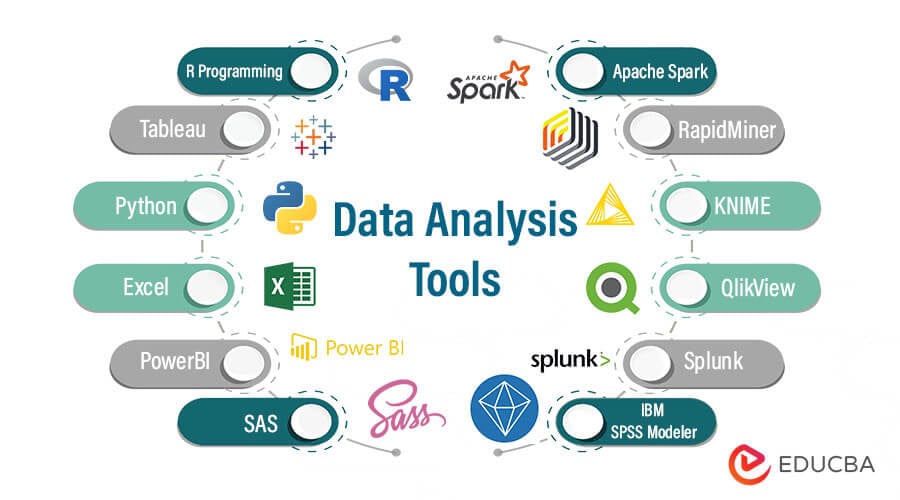
Several distinct data analysis tools cater to various needs and skill levels. Here’s a breakdown of some of the most popular options:
1. Microsoft Excel
Excel remains a cornerstone of data analysis, particularly for smaller businesses and individuals. It’s a versatile tool for basic statistical calculations, charting, and data manipulation. Its ease of use and widespread adoption make it a popular starting point for many data analysts. However, Excel’s limitations in handling large datasets and complex statistical modeling can be a drawback. It’s often used for creating pivot tables, charts, and basic data summaries. While still valuable, it’s increasingly being supplemented by more powerful tools.
2. Google Sheets
Google Sheets is a free, cloud-based spreadsheet program that offers a similar functionality to Excel. It’s particularly well-suited for collaborative projects and sharing data with others. Its integration with Google’s ecosystem (Gmail, Google Drive) is a significant advantage. It’s a great option for quick data exploration and simple analysis. It’s often used for creating dashboards and visualizations.

3. Tableau
Tableau is a leading data visualization tool renowned for its ability to create interactive dashboards and explore data visually. It’s particularly strong in business intelligence and allows users to quickly identify trends and patterns. Tableau’s drag-and-drop interface makes it accessible to users with limited technical skills. It excels at presenting data in a way that’s easy to understand and communicate to stakeholders. It’s widely used in marketing, sales, and operations.

4. Power BI
Microsoft Power BI is another powerful data visualization and business intelligence tool, tightly integrated with the Microsoft ecosystem. It’s often favored by organizations already using other Microsoft products. It offers a robust set of features for data modeling, reporting, and dashboard creation. Power BI’s strengths lie in its ability to connect to a wide range of data sources and its strong collaboration features.
5. Python (with Libraries like Pandas & NumPy)
Python is a versatile programming language that’s increasingly popular for data analysis. Libraries like Pandas and NumPy provide powerful tools for data manipulation, cleaning, and analysis. While requiring some programming knowledge, Python offers unparalleled flexibility and control over data processing. It’s commonly used for statistical analysis, machine learning, and building custom data analysis solutions. Numerous online resources and tutorials are available to help users learn Python.
6. R
R is a free and open-source programming language specifically designed for statistical computing and graphics. It’s widely used in academia and research, and it’s a popular choice for statisticians and data scientists. R offers a vast collection of packages for statistical analysis, data visualization, and machine learning. It’s known for its statistical capabilities and its ability to perform complex analyses.
Choosing the Right Data Analysis Tool
Selecting the appropriate data analysis tool depends heavily on your specific needs and technical expertise. Here’s a quick guide:
- Small Businesses/Individuals: Excel or Google Sheets are often sufficient.
- Business Intelligence & Reporting: Tableau or Power BI are excellent choices.
- Advanced Statistical Analysis: Python (with Pandas and NumPy) or R are preferred.
- Data Visualization & Exploration: Tableau and Power BI excel in this area.
Best Practices for Data Analysis
Regardless of the tool you choose, following best practices is crucial for ensuring the accuracy and reliability of your analysis:
- Data Quality: Start with clean, accurate data. Garbage in, garbage out!
- Data Cleaning: Handle missing values, outliers, and inconsistencies appropriately.
- Data Transformation: Transform data into a suitable format for analysis.
- Visualization: Choose the right chart type to effectively communicate your findings.
- Statistical Significance: Understand the statistical significance of your results.
- Documentation: Document your analysis process and findings.
The Future of Data Analysis
The field of data analysis is constantly evolving. Artificial intelligence (AI) and machine learning are increasingly being integrated into data analysis tools, enabling more automated and intelligent insights. Cloud-based data platforms are also becoming more prevalent, providing scalable and accessible data storage and processing capabilities. We can expect to see even more sophisticated tools and techniques emerge in the coming years, further transforming the way organizations make data-driven decisions. The trend is towards more automated insights and predictive analytics.
Conclusion
Data analysis tools are essential for organizations seeking to unlock the value of their data. By understanding the different types of tools available and following best practices, you can effectively leverage these tools to gain insights, improve decision-making, and achieve business objectives. Data analysis tools are no longer optional; they are a fundamental requirement for success in today’s data-rich environment. Investing in the right tools and training your team is a crucial step towards achieving a competitive advantage. Remember to continually evaluate your data analysis needs and adapt your approach as technology and business requirements evolve.
