Business analytics reporting is no longer a luxury; it’s a necessity for informed decision-making and sustained growth. In today’s dynamic business landscape, the ability to track, analyze, and interpret data effectively is paramount. Business analytics reporting provides the insights needed to understand customer behavior, optimize operations, and identify new opportunities. It’s about moving beyond simply collecting data to transforming it into actionable intelligence. This article will explore key strategies and best practices for crafting robust and impactful business analytics reports. We’ll delve into the core components, from defining clear objectives to selecting the right tools and presenting your findings in a compelling manner. Let’s begin.
Understanding the Importance of Business Analytics Reporting
The rise of data has created a deluge of information, and simply having data isn’t enough. Effective business analytics reporting bridges the gap between raw data and strategic understanding. Without a clear understanding of what is happening and why, decisions can be based on guesswork rather than evidence. Poorly executed reports can lead to wasted resources, missed opportunities, and ultimately, decreased profitability. Companies that prioritize data-driven insights are significantly more likely to achieve their goals. The shift towards a data-centric culture demands a fundamental change in how businesses approach information management. Business analytics reporting is the cornerstone of this transformation.

Defining Clear Objectives for Your Reports
Before you even begin collecting data, it’s crucial to define what you want to achieve with your reports. A vague or poorly defined objective will result in a report that’s irrelevant and ultimately, unhelpful. Start by asking yourself: What specific business question are you trying to answer? Are you aiming to improve customer retention, increase sales, optimize marketing campaigns, or streamline operational processes? Clearly articulating your objectives will guide your data collection, analysis, and reporting efforts. Documenting these objectives in a formal report or project plan is highly recommended. Consider using the SMART framework – Specific, Measurable, Achievable, Relevant, and Time-bound – to ensure your objectives are well-defined and attainable. For example, instead of saying “Improve customer satisfaction,” a SMART goal would be “Increase customer satisfaction scores by 10% within the next quarter by implementing a new feedback system.”
Key Components of a Successful Business Analytics Report
A well-structured business analytics report should be comprehensive and easy to understand. It’s not just a collection of numbers; it’s a narrative that tells a story. Here’s a breakdown of the key components:

Data Collection and Preparation
The foundation of any good report is reliable data. The first step is to ensure your data is accurate, complete, and consistent. This often involves data cleansing – identifying and correcting errors, handling missing values, and ensuring data integrity. Different data sources – CRM systems, website analytics, sales databases, marketing automation platforms – will require different approaches to integration. Consider using ETL (Extract, Transform, Load) processes to streamline the data flow and ensure data quality. Investing in robust data governance policies is also essential for maintaining data accuracy and consistency over time.
Data Analysis Techniques
Once you have your data, you need to analyze it. This involves applying various analytical techniques to identify trends, patterns, and insights. Common techniques include:
- Descriptive Analytics: Summarizing and describing historical data – understanding what has happened. This is often the starting point for many reports.
- Diagnostic Analytics: Investigating why something happened – uncovering the root causes of trends.
- Predictive Analytics: Using statistical models to forecast future outcomes – anticipating what might happen.
- Prescriptive Analytics: Recommending actions based on predicted outcomes – suggesting the best course of action.
Visualizing Data – Charts and Graphs
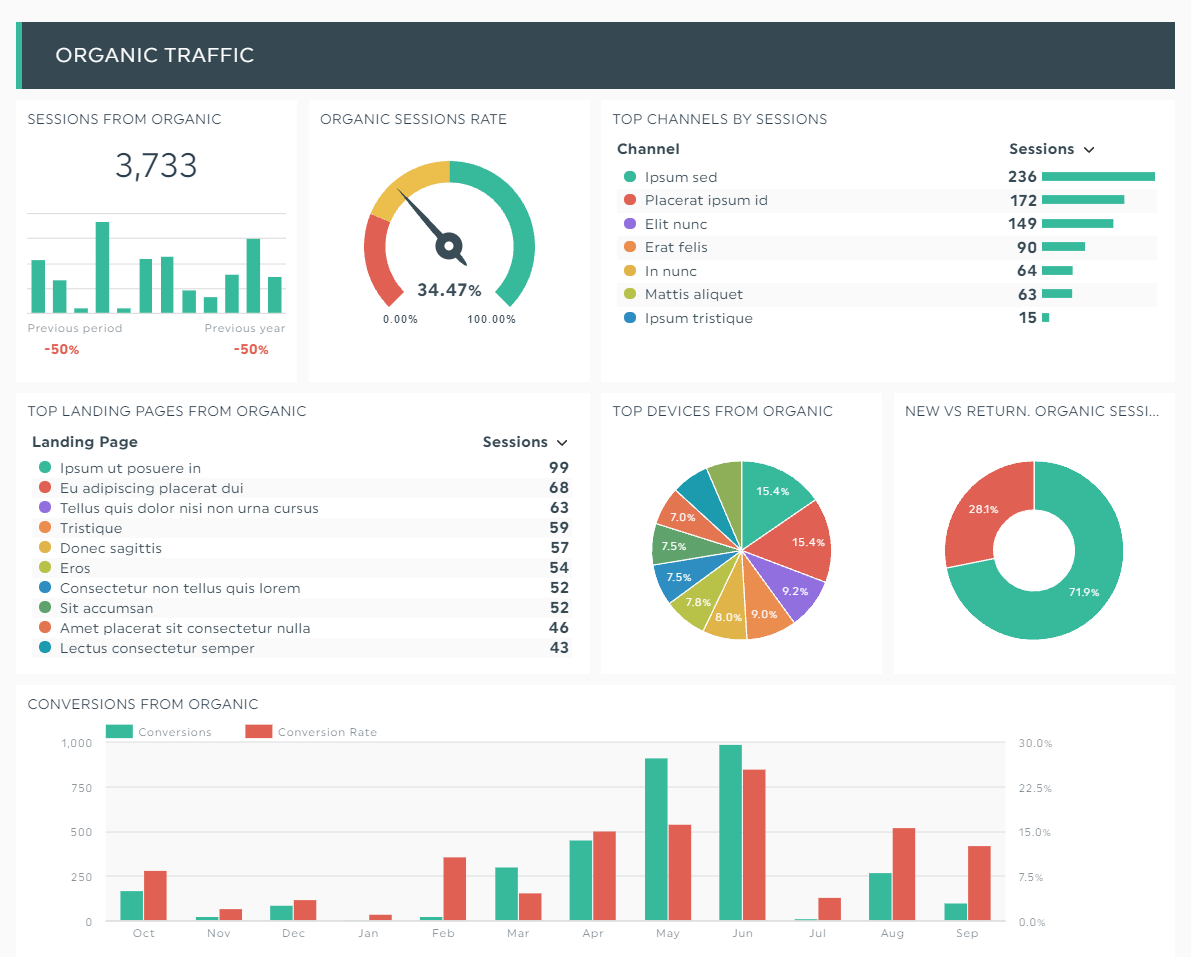
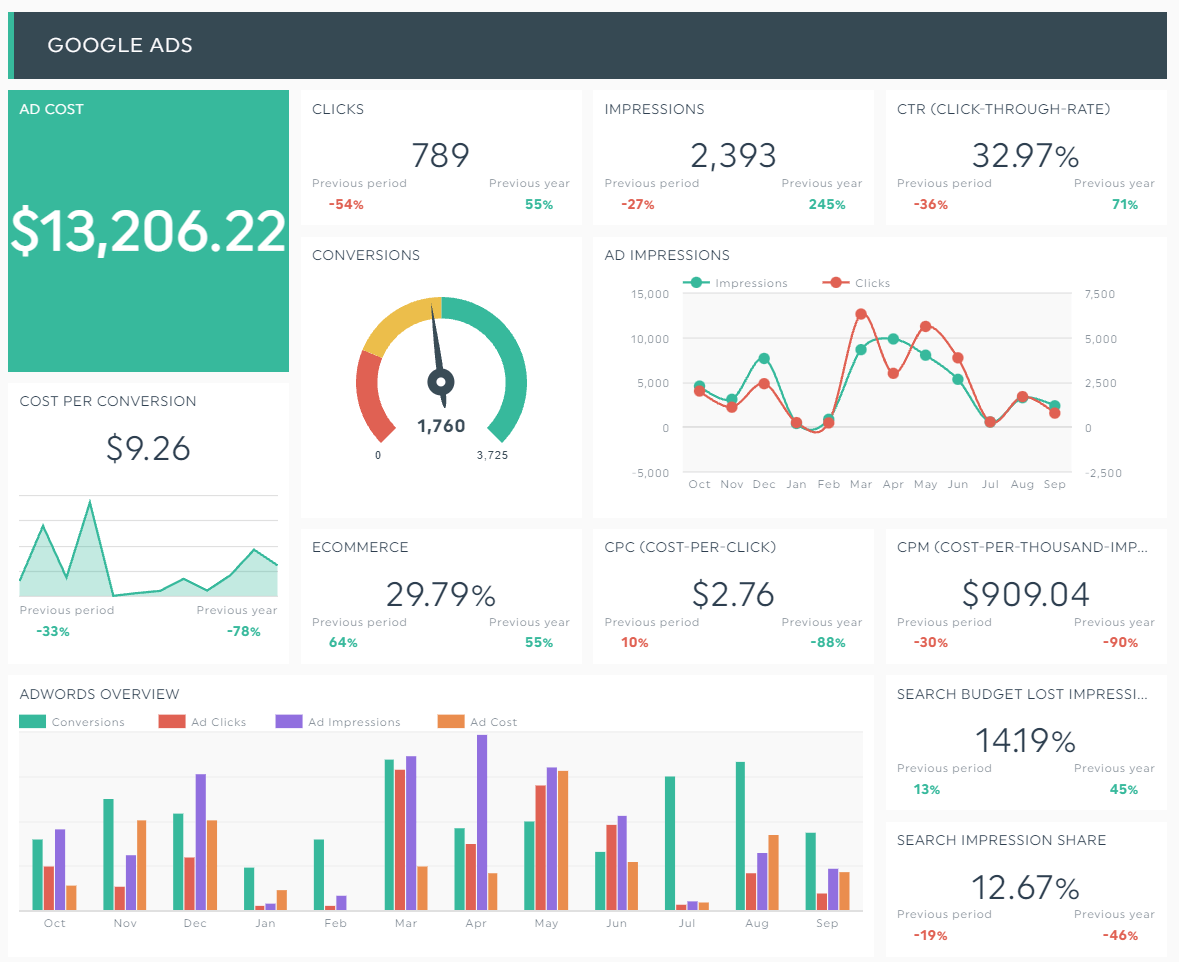
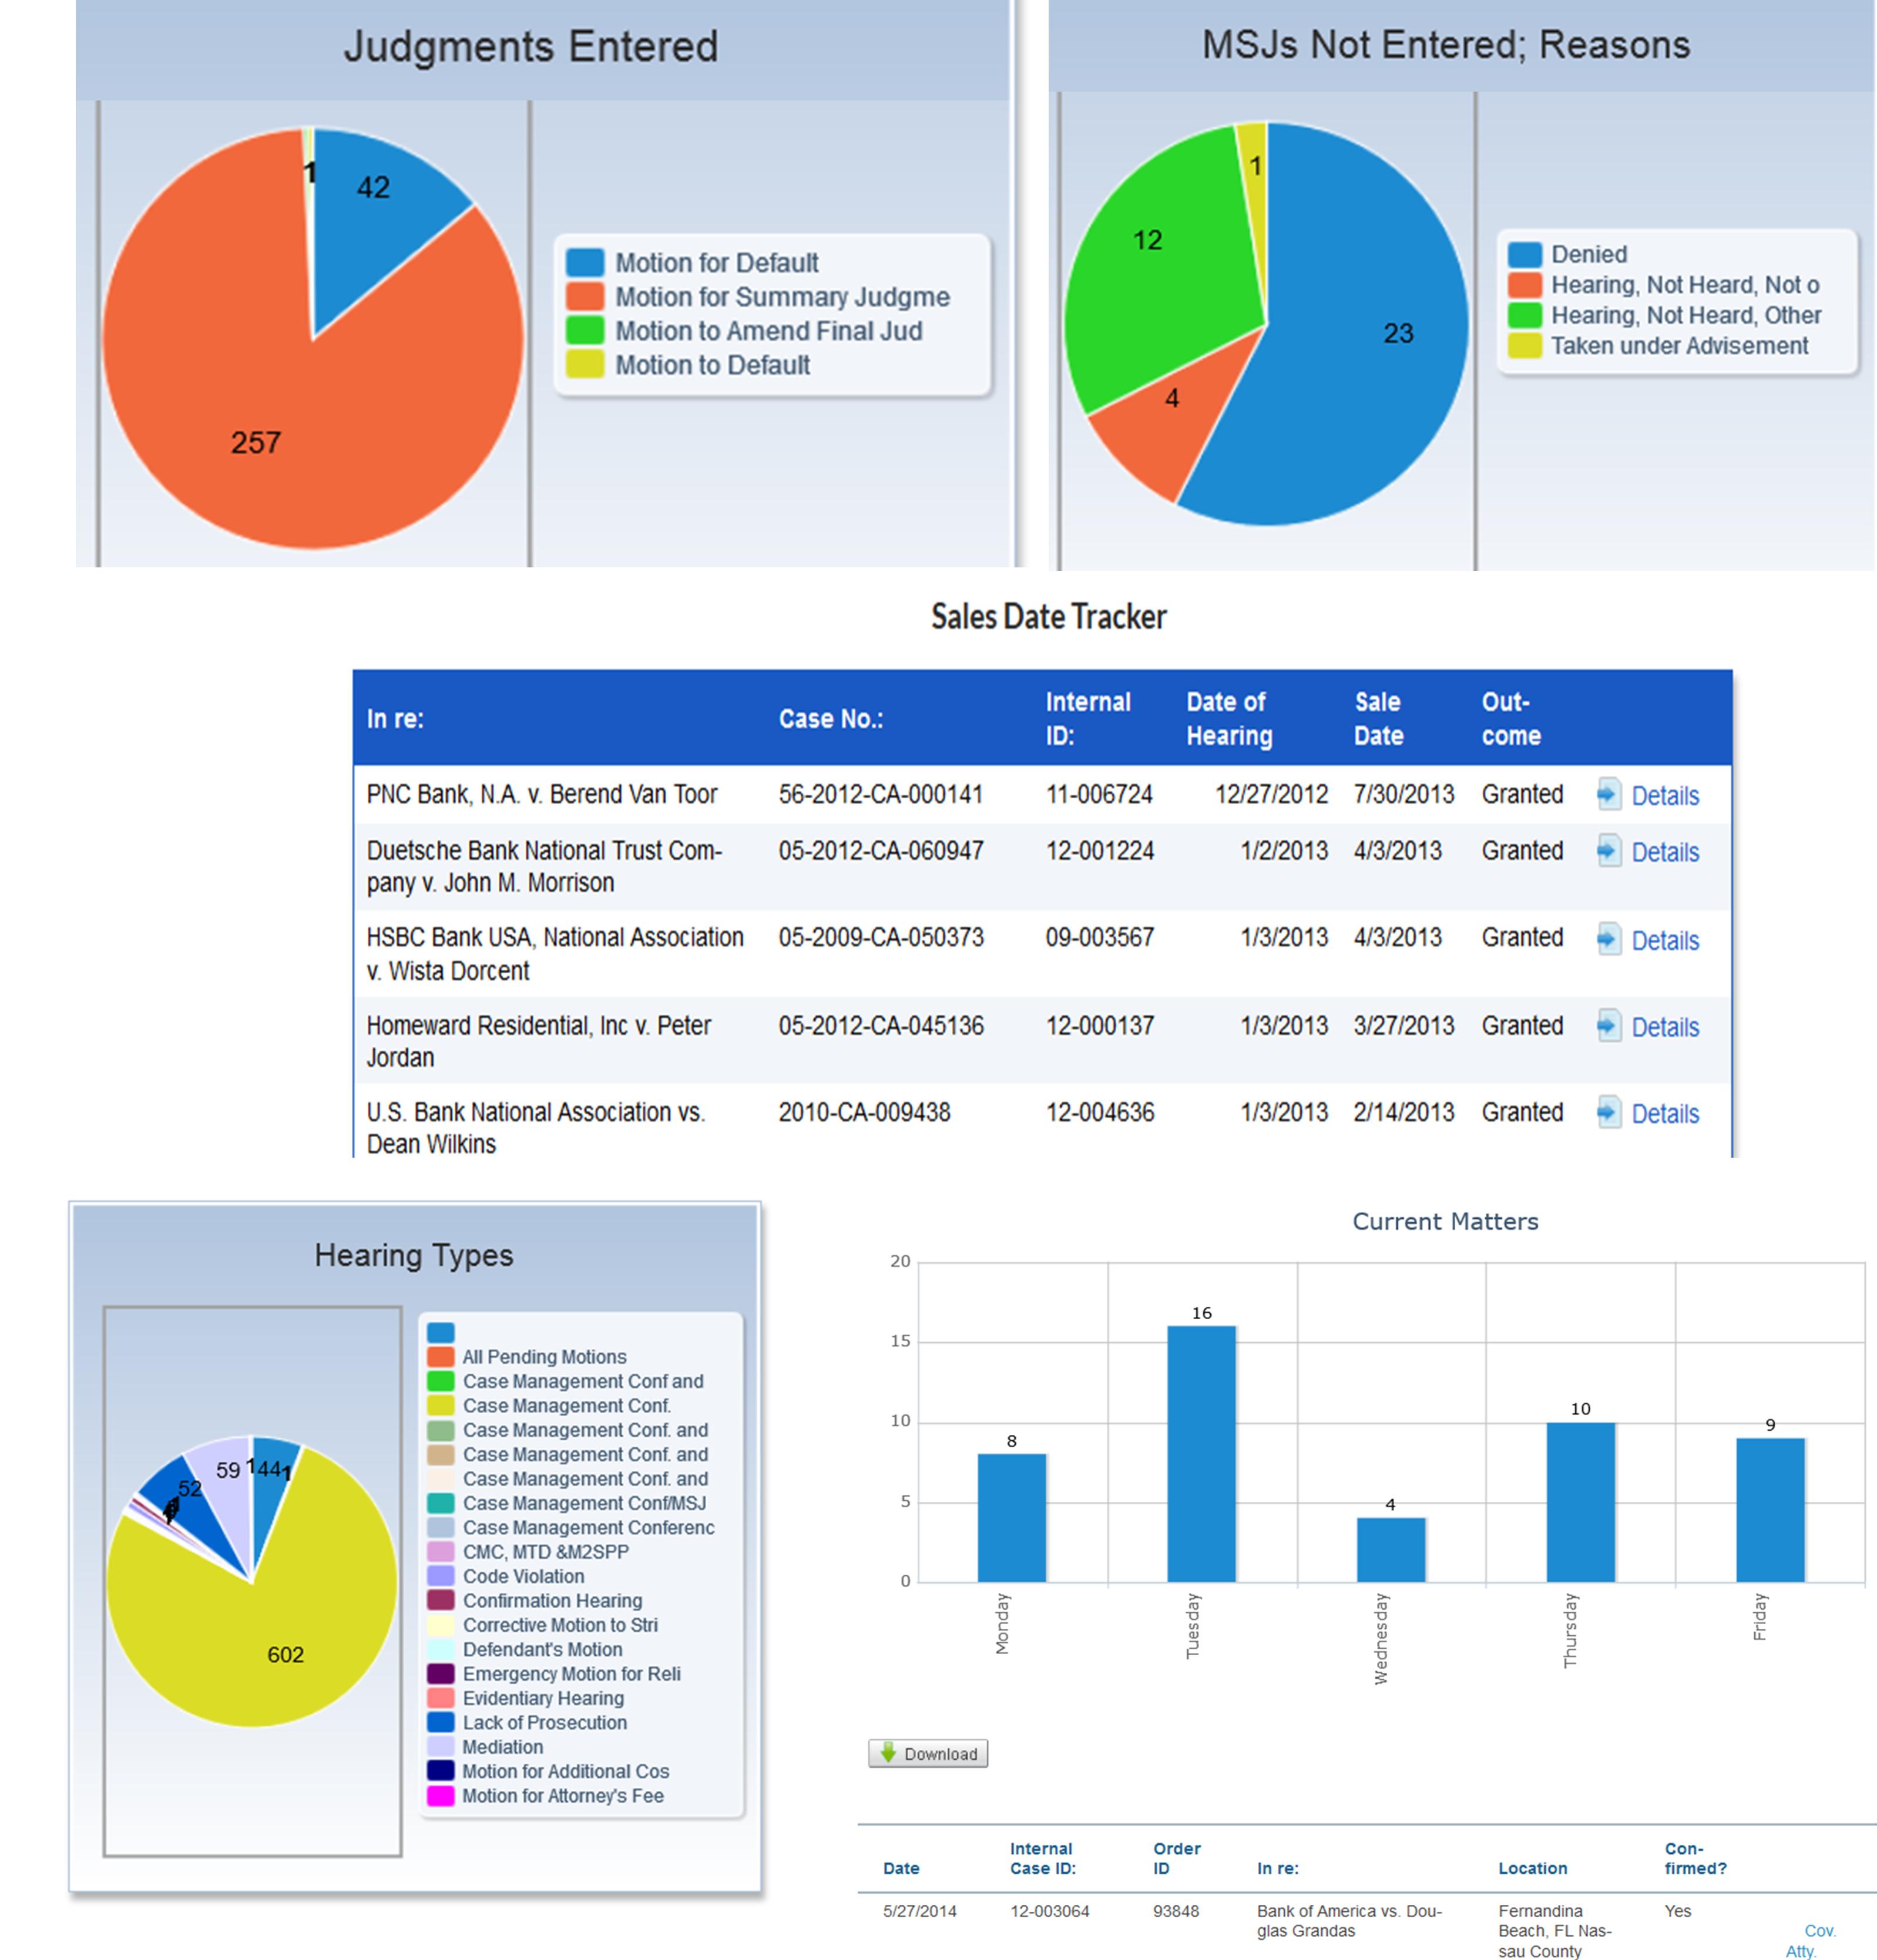
Data visualization is critical for communicating insights effectively. Choosing the right chart type – bar charts, line graphs, pie charts, scatter plots – depends on the type of data you’re presenting and the message you want to convey. Clear and concise visuals make complex data easier to understand. Avoid cluttered charts with too much information. Use color strategically to highlight key trends and patterns. Tools like Tableau and Power BI are excellent for creating interactive dashboards.

Key Metrics to Track
Selecting the right metrics is crucial for measuring the success of your business. These metrics should align with your objectives and provide a clear picture of performance. Some common metrics include:

- Revenue Growth: The percentage increase in revenue over a specific period.
- Customer Acquisition Cost (CAC): The cost of acquiring a new customer.
- Customer Lifetime Value (CLTV): The predicted revenue a customer will generate over their relationship with your business.
- Conversion Rates: The percentage of visitors who complete a desired action (e.g., purchase, sign-up).
- Churn Rate: The rate at which customers stop doing business with you.
Reporting Best Practices for Enhanced Impact
Beyond simply collecting and analyzing data, adopting best practices can significantly enhance the impact of your reports:

Tailoring Reports to Your Audience
Different stakeholders will have different needs and levels of technical expertise. Tailor your reports to the specific audience you’re addressing. A report for executives will need to be more high-level and focused on strategic implications, while a report for sales teams will require more detailed data and actionable insights.
Regular Reporting Cadence
Establish a regular reporting cadence – weekly, monthly, quarterly – to ensure that your data is kept up-to-date and that you can track progress against your objectives. Automated reporting tools can help streamline this process.
Actionable Insights – Don’t Just Present Data
Reports are only valuable if they lead to action. Don’t just present data; provide context, explain the implications, and suggest next steps. Focus on identifying opportunities for improvement and driving positive change.
Conclusion
Business analytics reporting is a vital component of a successful business strategy. By understanding the importance of data, defining clear objectives, selecting the right tools, and presenting your findings effectively, you can unlock valuable insights and drive informed decision-making. Business analytics reporting is not a one-time project; it’s an ongoing process of continuous improvement. As your business evolves, your reporting needs will also change. Continuously evaluate your reporting processes and adapt them to meet your evolving needs. Ultimately, effective business analytics reporting empowers businesses to achieve their goals and maintain a competitive edge. Investing in the right tools and training is essential for maximizing the value of your data. Don’t underestimate the power of well-crafted reports to transform data into actionable intelligence.